By Doug Sandler, Chris Konstantinos & Rod Smyth, RiverFront Investment Group
Optimism Back to ’04 – ’08 Levels
Valuation is a blunt instrument which we think is most helpful as a measure of optimism or pessimism. One of our preferred ways to look at US valuation uses the long term trend of earnings to calculate Price to Earnings bands. By this measure, the S&P 500 is back to its 2004 to 2007 range and hit the top of that range in January (see chart on page 2).
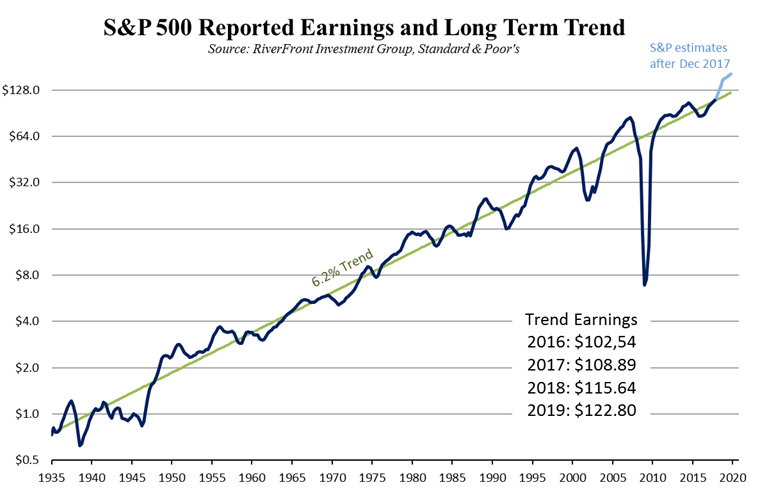
Valuation also comes in many different forms, Price to Earnings, Price to Cash Flow, Price to Book Value, Dividend Yield etc. Smoothing out earnings is helpful in our view, since company profitability can be volatile. Assessing the market through a ‘smoothed earnings’ lens lowers the risk of being overly optimistic at the end of the bull market, when earnings are near ‘peak’ or overly pessimistic at the bottom of a bear market when earnings are close to ‘trough’. Fortunately for the S&P 500 we have a long data series for earnings, which happens to have a fairly consistent trend (see chart below). Earnings for the companies in the S&P 500 have grown at a trend rate of 6.2% since 1935. Following the tax cuts, S&P is estimating earnings will rise considerably above trend, but we need to remember that in the next recession, reported earnings will again fall below trend.
![]()

Past Performance is no guarantee of future results. Shown for illustrative purposes only.
USING TREND EARNINGS TO VALUE THE S&P 500:
To get a sense of investor optimism and pessimism, we find it helpful to look at the S&P 500’s value based on trend earnings. (Actually we use the trend earnings level one year forward as we recognize investors are forward looking). Once a trend line is drawn, the good news is that trend earnings are knowable into the future, unlike actual earnings which are volatile. We can therefore draw a set of parallel lines, rising at 6.2%, representing different PE multiples of trend earnings. These are shown in our chart of the week, which also shows the S&P 500 and how it moves in relation to these valuation levels. We have chosen to show 12x, 15x, 18x, 21x and 24x, mainly because they cover most of the history of the last 15 years, and show some previous “regimes”. We make several observations from this chart:
- Since 1995 investors have been wildly optimistic (late 1990s) and deeply pessimistic (2008/9). To us it seems obvious that investors in the late 1990’s believed that a “new era” of earnings growth had arrived and so were willing to ignore the old trend. Equally, in early 2009, when actual earnings fell far below trend, investors were unwilling to believe they could recover to trend. Yet in both instances trend earnings were a reliable guide, in our view.
- At times, the S&P 500 settles into stable ranges of the trend earnings lines, such as 2004 to 2007; and 2010 to 2013, but more often it is moving through these ranges as confidence waxes and wanes. Hence, the “blunt” nature of a valuation metric. This analysis allows us to compare current periods with those of the past.
- At the recent peak in January, the S&P 500 traded slightly above 24x our trend earnings number, similar to the peak in 2007. While retail investor confidence still seems fairly fragile and we see few signs of euphoria, this work tells us that a prolonged period of low interest rates and rising stock prices has allowed this valuation metric to return to the levels that preceeded the 2008 downturn. This confirms our Price Matters® work which suggests that US stocks are vulnerable to a downturn in the business cycle.
The Weekly Chart: Valuation Back to 2007 Levels

Source: Standard & Poors, RiverFront. Past performance is no guarantee of future results.Shown for illustrative purposes only.
CONCLUSION: There is no telling where valuation will peak in this cycle, but it seems clear to us that investors are not building in much probability of a business cycle downturn. Our advice: Don’t leave the stockmarket “party” while the band is playing, but now is not the time for excessive risk taking, that will leave you with a hangover.
Doug Sandler, CFA, is Global Strategist; Chris Konstantinos, CFA, is Chief Investment Strategist; and Rod Smyth is Director of Investments at RiverFront Investment Group, a participant in the ETF Strategist Channel.
Important Disclosure Information
The comments above refer generally to financial markets and not RiverFront portfolios or any related performance. Past results are no guarantee of future results and no representation is made that a client will or is likely to achieve positive returns, avoid losses, or experience returns similar to those shown or experienced in the past.
Information or data shown or used in this material is for illustrative purposes only and was received from sources believed to be reliable, but accuracy is not guaranteed.

