
By: Denis Rezendes, CFA®
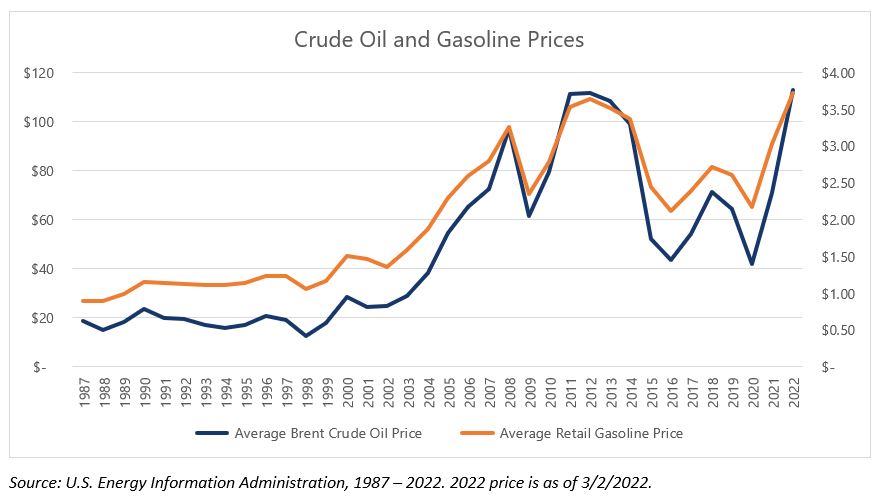
Following the Russian Federation’s invasion of Ukraine, Brent Crude Oil futures climbed over $100 a barrel for the first time since 2014. On March 4th, the benchmark price rose by $7.96 to $112.93—the largest such increase since June of 2008. In the United States, we’ve consumed nearly 20 million barrels of oil a day, on average, over the past 5 years. On this single day, the daily cost to fuel the U.S. economy increased by nearly $160 million dollars to over $2.2 billion dollars. Just over 40% of this oil is used to produce gasoline, one of the most visible and volatile inputs to U.S. consumer’s budgets[1].
It’s difficult to overstate the importance of gasoline to the U.S. consumer, both culturally and economically. Nearly all travel that takes place in the United States, whatever the purpose, takes place in a car. In 2019, cars were responsible for 99.6% of the 3.2 trillion vehicle-miles traversed by planes, trains, and automobiles in the United States[1]. Even adjusting for the higher occupancy of other modes of transportation, a statistic called passenger-miles, the number was still 87.3%[2]. To fuel this travel, the majority of American’s filled up their tank at least once a week[3] consuming 146 billion gallons of gasoline.
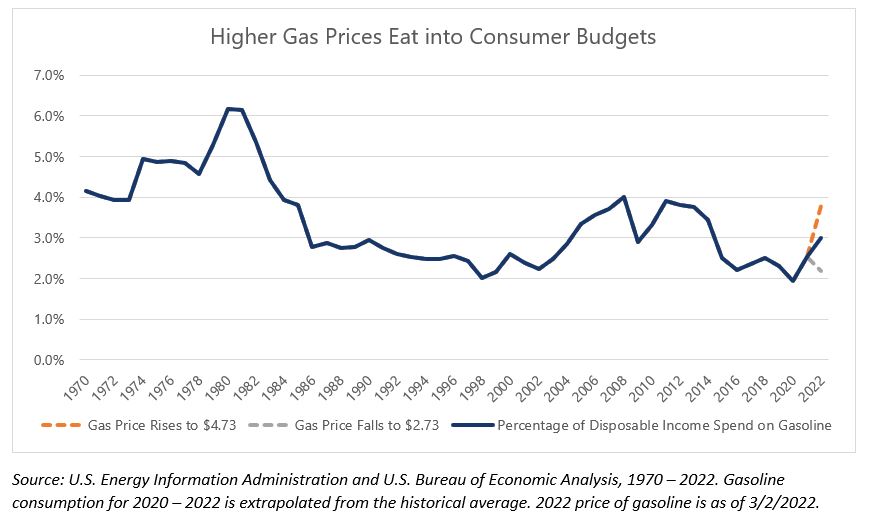
There’s little debate that the price of gasoline is a major input into consumer’s perception of their economic well-being, but we wanted to explore the actual economic impact of rising prices. Over the past 50 years, per capita gasoline consumption has remained remarkably consistent, averaging 466 gallons per year. While the price at the pump has risen over time, disposable incomes have as well. In 1980, the 463 gallons of gasoline purchased for $1.18 a gallon by the average American cost a record 6.16% of disposable income. In 2012, when gasoline prices averaged a record $3.54 a gallon, the 426 gallons purchased by the average American only cost 3.79% of disposable income. For expenditures as a percentage of disposable personal income to hit the same level as 1980, we estimate that gasoline prices would need to double again from today’s prices to over $7 a gallon.
Gasoline may be a smaller percentage of disposable income than it was in the past, but higher prices still have a detrimental impact on consumer budgets. The remarkable consistency of gasoline consumption indicates that consumers have little ability to modify their driving habits in response to changing prices. Consumers have no choice but to pay the price at the pump and every $0.10 rise in the price of gasoline costs the average consumer just over $40 a year. A $1 increase in price, as we’ve seen over the past year, could end up costing over $400. For a consumer who expected to save ~$3,700[1] in 2022 this is a 10% decrease in expected savings.
Strangely, the pandemic was a relatively favorable period for consumer finances in aggregate. Going “back to normal” is already squeezing consumers as expenses return to normal levels amid rising inflation. Perhaps it’s no surprise that consumers grade the economy poorly[2], despite strength in nearly every traditional economic metric. Gasoline prices may not matter as much as they used to, but higher prices are particularly unwelcome given the totality of the financial situation facing consumers today.
This article was contributed by Denis Rezendes, Partner and Portfolio Manager at Beaumont Capital Management, a participant in the ETF Strategist Channel.
For more insights like these, visit BCM’s blog at blog.investbcm.com.
[1] https://www.eia.gov/energyexplained/oil-and-petroleum-products/use-of-oil.php
[2] https://www.bts.gov/content/us-vehicle-miles
[3] https://www.bts.gov/content/us-passenger-miles
[4] https://www.reviews.com/insurance/car/drivers-fueling-behavior-after-covid/
[5] Using estimated 2022 personal disposable income and January 2022’s personal savings rate
[6] https://news.umich.edu/consumer-sentiment-sinks-to-decade-low/
Disclosures:
Copyright © 2022 Beaumont Capital Management LLC. All rights reserved. All materials appearing in this commentary are protected by copyright as a collective work or compilation under U.S. copyright laws and are the property of Beaumont Capital Management. You may not copy, reproduce, publish, use, create derivative works, transmit, sell or in any way exploit any content, in whole or in part, in this commentary without express permission from Beaumont Capital Management.
The charts and info-graphics contained in this blog are typically based on data obtained from 3rd parties and are believed to be accurate. The commentary included is the opinion of the author and subject to change at any time. Any reference to specific securities or investments are for illustrative purposes only and are not intended as investment advice nor are they a recommendation to take any action. Individual securities mentioned may be held in client accounts. Past performance is no guarantee of future results.
