

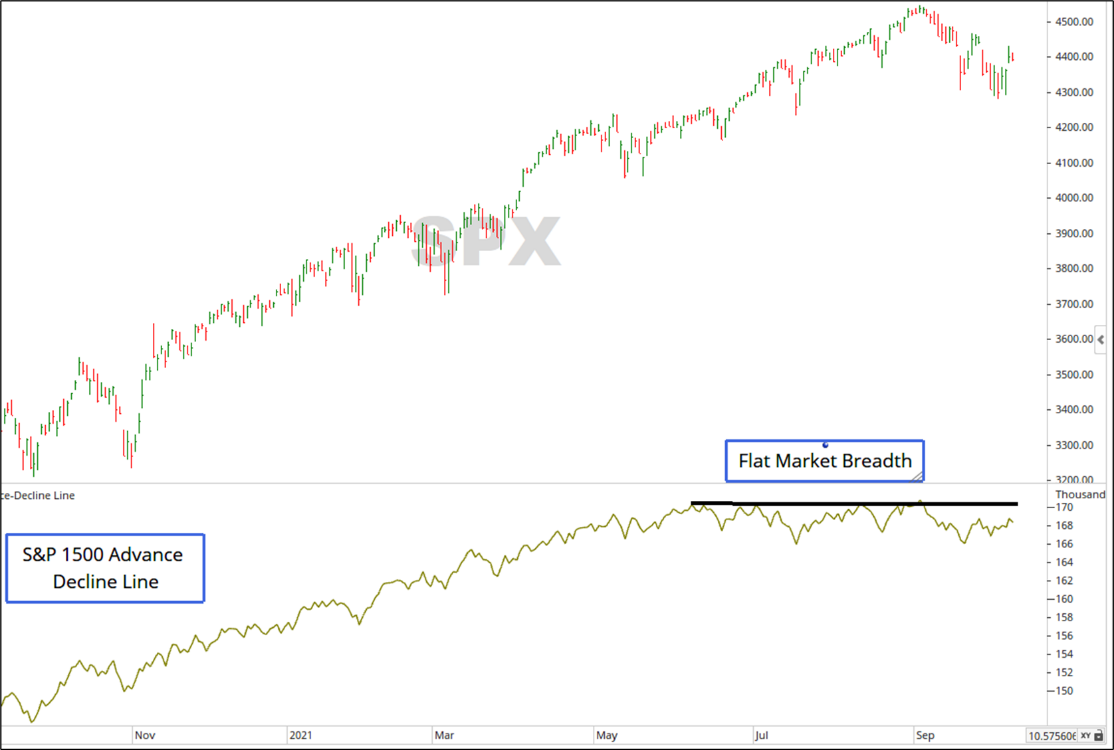
Most of our readers are familiar with the concept of the Advance-Decline Line. For those that are not, the Advance Decline Line measures market breadth, or the number of advancing securities versus declining ones. The A/D Line often indicates how “healthy” the market is at a given point. A rising A/D Line coupled with a rising market signals that “a rising tide is lifting all ships.” A falling A/D Line in combination with a rising market shows that the market is being carried higher by fewer, larger name stocks.
In the last few months, we have seen a flattening Advance Decline, in combination with a rising market. In other words, the market has been led by the larger securities, while smaller securities move down or sideways.
The chart below shows the S&P 500, along with the stocks-only A/D Line for the S&P 1500 (the 1500 largest capitalized US stocks):
Source: Optuma Market Breadth Data
Now, let’s look at market breadth from a different viewpoint. Where do securities in relation to the rest of the market?
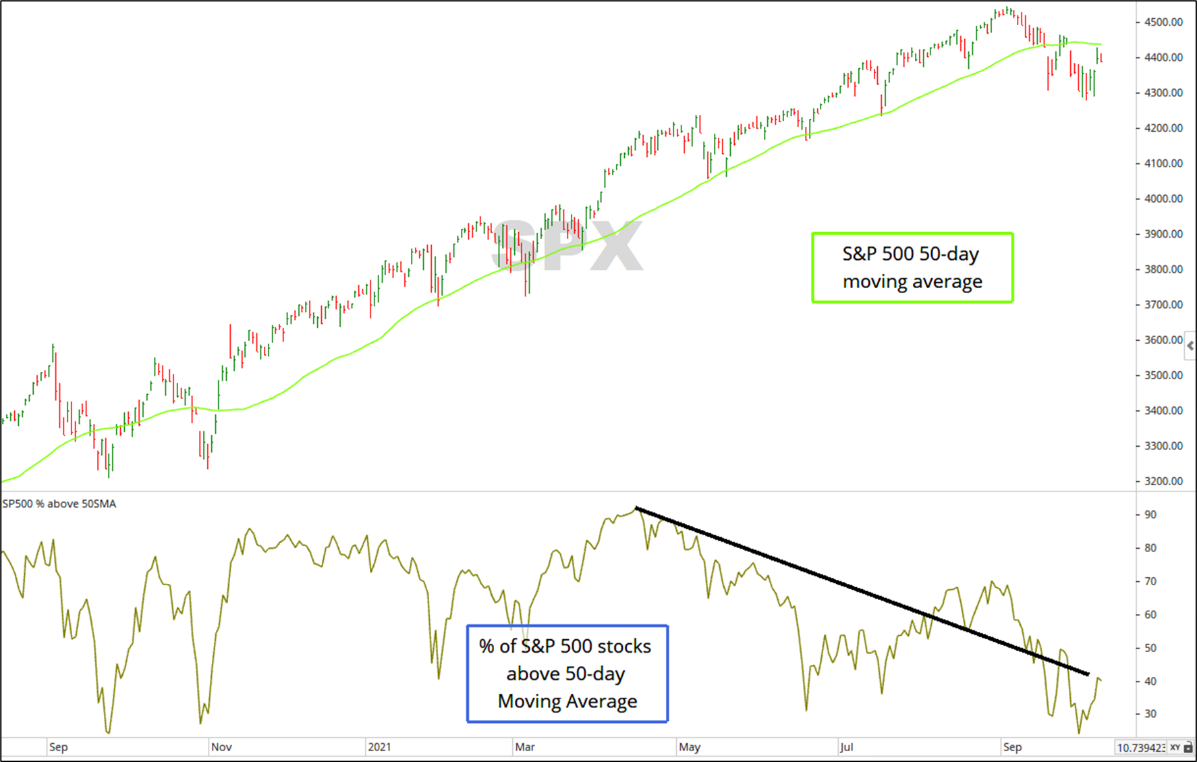
The 50-day moving average:
Currently, the S&P 500 is right around its 50-day moving average of price. Moving averages, usually in round numbers like 50-day, 100-day, 200-day, often prove to be points of significance. In other words, moving averages can act as points of support or resistance. The chart below displays the S&P 500, along with its 50-day moving average. The lower half of the chart displays the percentage of stocks in the S&P 500 that are above their respective 50-day moving average. This number has been declining since March. The current percentage of stocks within the S&P 500 that are above their 50-day moving average sits at 41%.
Source: Optuma Market Breadth Data
So, over half of S&P 500 securities are below their respective 50-day moving averages. Where is this coming from? The following chart shows the percentage of stocks within each sector that are above their 50-day moving averages:
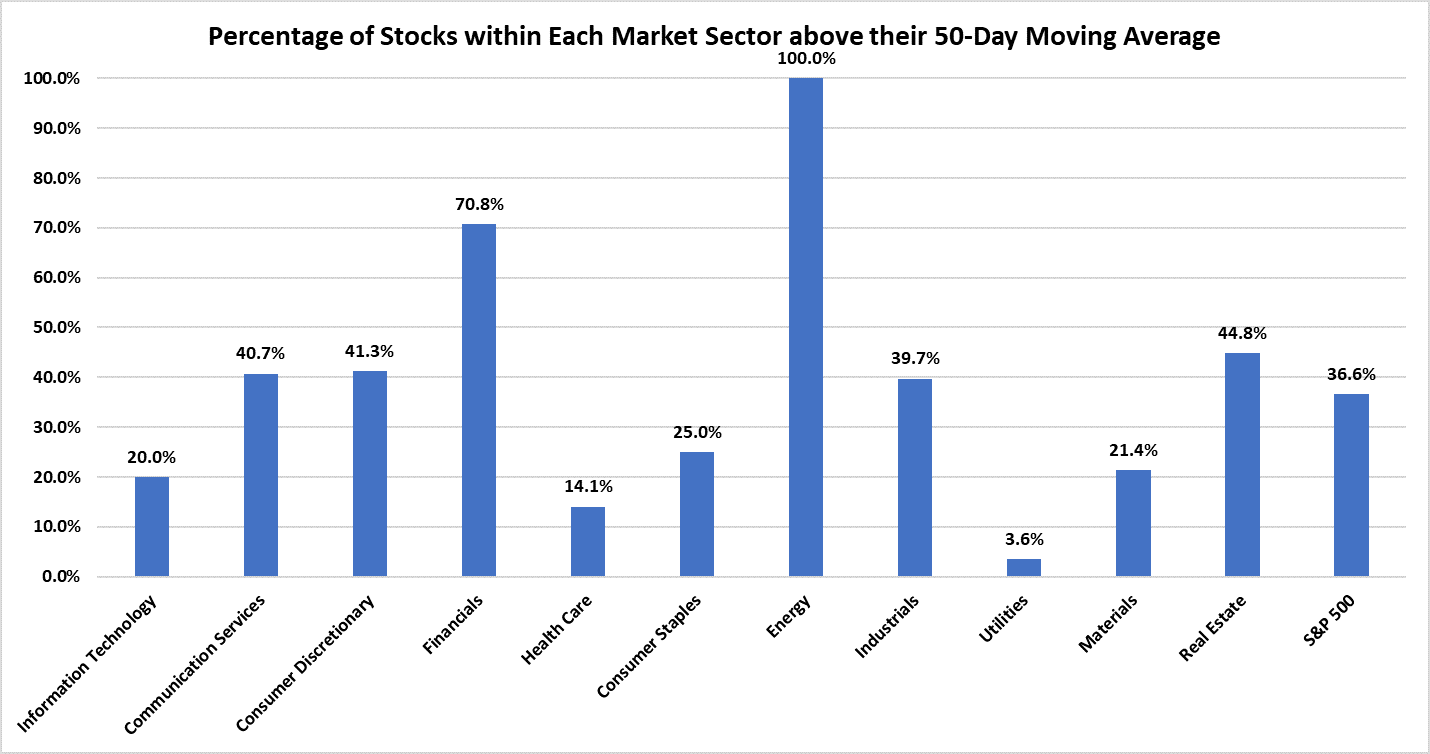
Source: Optuma S&P 500 data, as of 10/11/2021
The largest sector in the market is Information Technology. When you combine this sector with Communications Services and Health Care, these 3 sectors make up 52% of the total market capitalization in the S&P 500. So just for summary, 3 sectors of the market account for more of the market’s movements than the other 8 sectors combined.
Now, let’s venture back a little over 1 month ago when the market was at a peak. Nearly 70% of S&P 500 stocks were above their respective 50-day moving average. Notice the change in the percentage of stocks above and below their 50-day moving average. Then take into account the impact that each sector has on the market, which is shown in the x-axis label as a percentage.
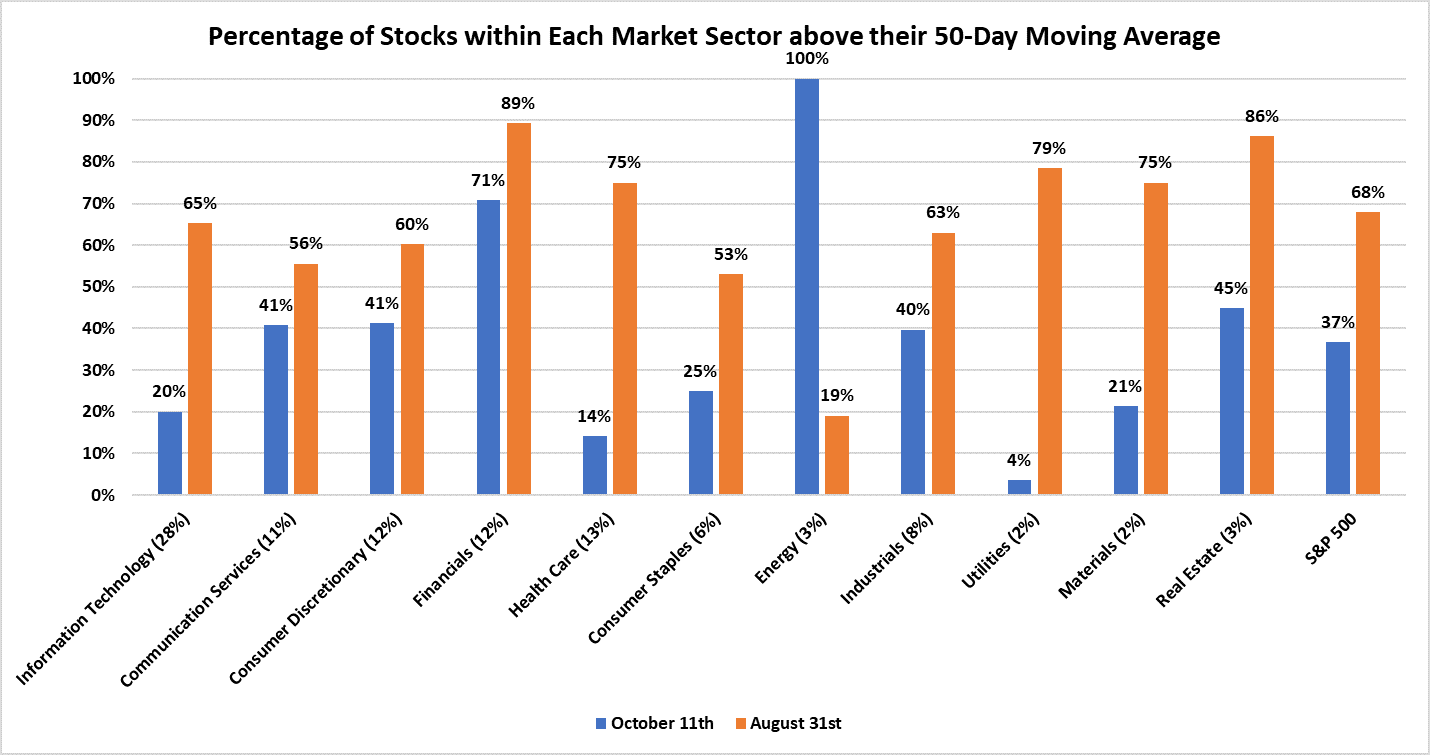
Source: Optuma S&P 500 data, as of 10/11/2021 & 8/31/2021
Here is a quick summary of what is happening in the above chart:
- While Utilities and Materials saw large declines in percentage of stocks above their 50-day moving averages, they only make up 4% of the S&P 500’s movement.
- The largest sector, information technology, now only has 20% of its stocks above their 50-day moving averages. Health Care also saw a significant decline going from 75% above their 50-day moving average to only 14%.
- Energy saw a more than significant rise, as oil prices surged in the past month. Energy stocks only account for 3% of the market’s fluctuations.
Bottom Line
The recent pullback in the market has been led primarily by the same securities that carried the market higher previously. Information Technology and Health Care saw large declines in number of stocks above their 50-day moving averages. These two sectors account for a significant portion of the S&P 500’s fluctuations. A sector like energy saw a sharp rise, and Financials did not experience a meaningful change other than normal market fluctuation.
Keep in mind that the 50-day moving average is not some “end all be all” indication of where the market is heading. The point here is that the S&P 500 is around, and slightly, below that moving average. One would expect that if the market was sitting on its moving average, then around half the index’s securities would be above that line. But, because the market has a majority of its allocation in technology-related securities, and those securities have suffered more recently, although not outside of a normal pullback, there will be a lower percentage of securities above their 50-day moving average.
We will continue to keep an eye on the markets and specifically technology stocks. As technology goes, the S&P 500 will follow. Should there continue to be a rotation away from technology, and technology continues to experience volatility, that would be a negative sign for the overall market environment. That hasn’t happened yet, but it is something to be mindful of.