

By Adam Grossman, CFA
SUMMARY
- We believe, international stocks not as ‘cheap’ as they first appear.
- Economic and earnings trends need to be positive to close valuation gaps.
- Current economic climate still favors a more growth-oriented US versus international.
Economic Climate Still Favors US Stocks for Now
Our Framework: Price Matters… but so Does Macro and Earnings Data
With the S&P 500 making all-time highs, and international equities achieving lower returns over the past decade, a question RiverFront often gets is when will we go ‘overweight’ on international? Looking solely at valuations, it is a fair question. Using our Price Matters® framework, which draws a long-term total return trend through equity prices, we can see that as of November 2023, US large-cap equities are well above their long-term trend (see Figure 2, next page), while developed international equities (as represented by the MSCI Europe, Australasia and Far East Index – aka EAFE) are extraordinarily below their long-term trend. Even if we use what we believe to be a more appropriately conservative lower trend line for EAFE that removes the impact of foreign currency fluctuation relative to the dollar (Figure 1, below), the valuation gap relative to trend between US Large Cap and EAFE appears to make a compelling case for international, in our view.
FIGURE 1: International in Local Currency Below Trend
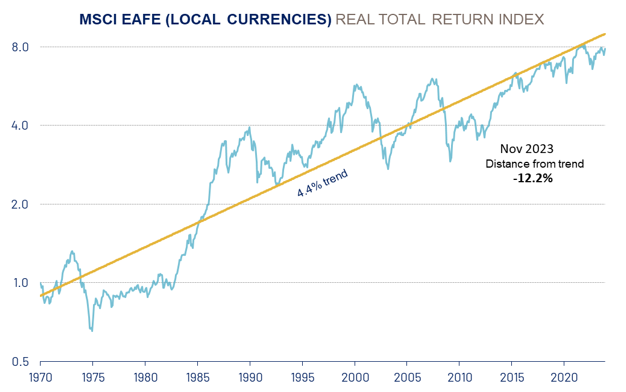
Source: RiverFront Investment Group, Factset. Data from Jan 1970 through Nov 2023. Past performance is no guarantee of future results. It is not possible to invest directly in an index. RiverFront’s Price Matters® discipline compares inflation-adjusted current prices relative to their long-term trend to help identify extremes in valuation. Blue line represents the MSCI EAFE (local) Real Return Index. Yellow line represents the Annualized Real Trend Line of MSCI EAFE (local) Real Total Return Index according to Price Matters®. Shown for illustrative purposes only, not indicative of RiverFront portfolio performance. Information or data shown or used in this material was received from sources believed to be reliable, but accuracy is not guaranteed. The chart above uses a logarithmic scale. Line movements will be dampened/subdued based on the exponential y-axis.
But all else is not equal…in our view, the US has stronger fundamentals. Thus, we believe this valuation gap is justified when we take a step back and look at the complete picture.
Placing valuation differences into context, we believe there are three elements that drive equity returns over time:
- The Macroeconomic Environment: In our view, most economic data is like “blood pressure;” any reading that is too high or too low requires action by a fiscal or monetary authority. We believe there is a sustainable level of economic growth and inflation at which well-run companies can thrive. For example, inflation rates of 2-3% along with positive trending leading economic indicators is a good combination, in our opinion.
- Evidence that Earnings Are Capturing Economic Growth: Using a combination of historic and consensus earnings analysis, we attempt to identify stable and growing earnings that are consistent with current economic activity.
- A Reasonable Starting Valuation: We see valuation as a long-term sentiment gauge of a market’s earnings power and profitability. Without a view of this earnings power – and the economic forces that drive these earnings – we can easily overpay for growth or buy assets we think are ‘cheap’ but fail to generate earnings. Thus, we view valuation as a ‘condition’… and not necessarily a ‘catalyst’ to generate returns.
Using this framework, our position on international equities becomes clearer; while valuations have been attractive to us, a lack of earnings power weakens the international thesis. It is important to remember that this mosaic is fluid and ever-changing. As such, in this week’s Strategic View, we wanted to spend some time walking through how we think economics and earnings affect the relative performance between the US and international markets, and what the current data and our understanding of history is telling us about them. The first part of this analysis is to look at two historic periods that we think are analogous to current conditions.
Historic Episode #1: US Post-Korean War: Economic Environment Justified Above-Trend US Market
The end of the 1930s through the early 1950s was a time of great global conflict. With much of the world in a state of recovery and national debt at extremely high levels, the United States took a novel approach to solving its debt problem; the Federal Reserve set interest rates below the rate of inflation and let them remain there for over a decade. This allowed debt to “shrink” in purchasing power terms to the rest of the economy.
Additionally, there was healthy economic and earnings growth due to the stable earnings environment, as well as the US and global infrastructure build. Looking back at the period from 1952 to 1966 in Figure 2 (right), we see sustained prices above trend for well over a decade. Looking forward, if inflation settles in at a 2-3% rate, which we think it will, the Fed can potentially return to interest rates at or below that level. Thus, we believe the current slight overvaluation will not be an obstacle to reasonably positive nominal US large cap returns. (For more details, see RiverFront’s current Long-Term Capital Markets Assumptions.)
FIGURE 2: US Stocks Above Trend
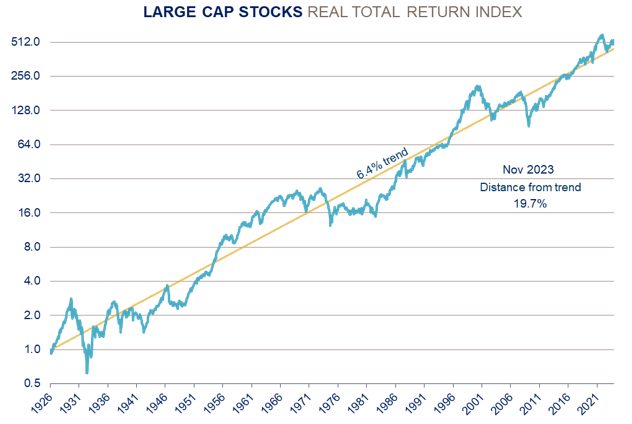
Source: RiverFront Investment Group; calculated based on data from CRSP 1925 US Indices Database ©2024 Center for Research in Security Prices (CRSP®), Booth School of Business, The University of Chicago. Data from Jan 1926 through Nov 2023. Past performance is no guarantee of future results. It is not possible to invest directly in an index. RiverFront’s Price Matters® discipline compares inflation-adjusted current prices relative to their long-term trend to help identify extremes in valuation. Blue line represents the Large Cap Real Return Index. Yellow line represents the Annualized Real Trend Line of Large Cap Real Total Return Index according to Price Matters®. Shown for illustrative purposes only, not indicative of RiverFront portfolio performance. Information or data shown or used in this material was received from sources believed to be reliable, but accuracy is not guaranteed. The chart above uses a logarithmic scale. Line movements will be dampened/subdued based on the exponential y-axis.
Historic Episode #2: The Mid and Late 1980s, the Biggest Move in International from Below to Above Trend
When we look at international valuations in Figure 1 (on the first page), in the mid-1980s they were also well below trend, similar to today. Subsequently, Japan went through a period focusing on economic growth and profitability that lasted for almost a decade. In 1985, the world’s finance ministers, and central bankers entered an agreement to weaken the strong US dollar. The meeting was held at the Plaza Hotel in New York and became known as the Plaza Accord.
This led to a huge rise in currencies all over the world versus the dollar, especially the yen. Coupled with a collapse in oil prices, inflation declined and so did interest rates. The Japanese were able to make inroads into several high-growth industries and low rates benefited domestic companies, especially banks. This positive catalyst led to outsized returns for Japanese and thus international stocks. Like the early 1980s, international stocks today are also below trend. However, unlike the mid-to-late 1980s, international has not yet experienced a positive economic catalyst to unlock that value. The economic situation today is thus different so far.
Next, we examine what this potential future catalyst might be in order to unlock international potential returns. We suspect this catalyst may have to do with shifting global business ‘climates.’
US and International Thrive in Different Business Climates
One major difference between the makeup of US large-caps and EAFE is that the US has a much higher weighting towards ‘growth’ companies, whereas EAFE is dominated by ‘value’ companies. Specifically, growth companies tend to thrive in lower-interest-rate environments, where GDP growth tends to be lower. In these environments, their organic growth provides high levels of profitability, and they can utilize the low interest rates to repurchase shares using cheap debt. Put simply: growth companies can squeeze earnings out of a slow and steady economy.
On the other hand, value companies tend to perform well in times of elevated economic growth. The higher growth helps cover their higher fixed costs, which then allows for higher margins on sales; we call this “operating leverage.” Put simply: when economic growth is high, this operating leverage tends to allow value-oriented companies’ earnings to outgrow more stable, less economically sensitive sectors.
The US benchmark S&P 500 index, with its large concentration of technology, consumer discretionary, and communication services companies, is one of the most growth-heavy markets in the world. International markets, in contrast, have much heavier allocations to value-oriented companies like banks, industrials, and energy. While there are also more defensive companies in international markets than in US markets, such as consumer staples or utilities, the major difference is in value and growth, in our view.
We can see this dichotomy at work when looking at earnings in markets from 2008-2022 (see Figure 3, right), an era that strongly favored US markets over international. This era was marked by disinflation and even occasionally deflation in various economies, which led to much slower nominal economic growth. This economic dynamic hurt earnings for the value sectors and benefitted the growth ones, in our view. Overlaying that was a secular technology revolution, which we believe is still going strong today. This dynamic is why the S&P 500 has dramatically outearned EAFE since 2008, in our opinion.
Thus, the business ‘climate’ was a leading factor favoring growth stocks, a phenomenon which played out both domestically and overseas. In addition, due to superior management and shareholder focus, US value stocks outperformed their non-US counterparts, and a lack of labor market reforms in areas like Europe also contributed.
Figure 3: US Earnings Dominate vs. EAFE
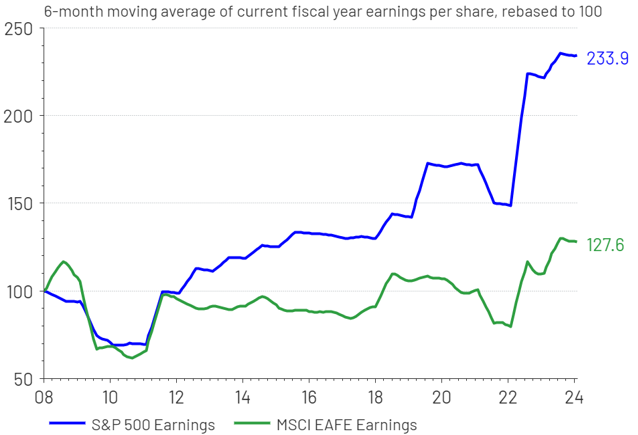
Source: LSEG Datastream, RiverFront; data weekly, as of January 2, 2024. Chart shown for illustrative purposes only. Past performance is no indication of future results.
Conclusion: Developed International Not Compelling Yet… and What Might Change Our Mind
Beginning in 2022, the economic picture changed sharply, with much higher interest rates and inflation making a rapid appearance. If this persists, it is possible that the financial climate could shift from favoring growth to value investing.
Inflation in the 2-3% range is our most likely outcome over the next year, and we think this higher range will be persistent through the next five to seven years. This means strong nominal growth relative to the last 15 years, and hence the potential for value – and thus international – to outperform. Here is our current assessment of how that is playing out:
US Equities: Continuing to Get the Gold Star
- US Economic Environment: We expect that the Fed will be able to bring shorter-term interest rates down well below 4% from here, albeit much slower than the market expects. Labor markets, leading activity indices, and confidence surveys are all strong, which creates a background for strong earnings growth.
- US Earnings: Earnings have been strong, and we think that continues for most US sectors. We believe that the focal point going forward is avoiding companies whose margins get squeezed by rising input costs or interest expenses.
- US Valuations: While valuations are above trend, we believe that the structurally strong earnings growth justifies that multiple. Thus, while we believe that other asset classes that are cheap, such as international, might do better over the next 5-7 years, we believe that returns for US stocks of 6-8% are easily achievable, as they were in the post-Korean War period we discussed.
Developed International Equities: Still Searching for a Catalyst
- EAFE Economic Environment: While we believe that the rate and inflation environment we are likely to enter should favor the more value-oriented companies that dominate these markets, economic activity and confidence as measured by corporate managers are still showing contraction in most international markets. We are waiting for these forward-looking measures to begin to reflect some macroeconomic tailwinds.
- EAFE Earnings Picture: So far, this lack of economic activity is being reflected in weaker earnings data. We will need to see a shift to earnings growth before we make larger allocations to developed international.
- EAFE Valuations: Considering the first two points, we believe for now that international broadly faces enough growth headwinds to warrant its steep discount. However, we recognize that not all countries in the international markets move in lockstep. Moving forward, we will look for markets and themes that defy this general assessment and seek to allocate to markets that are positioned to benefit from the shifts in the macro environment.
Risk Discussion: All investments in securities, including the strategies discussed above, include a risk of loss of principal (invested amount) and any profits that have not been realized. Markets fluctuate substantially over time and have experienced increased volatility in recent years due to global and domestic economic events. Performance of any investment is not guaranteed. In a rising interest rate environment, the value of fixed-income securities generally declines. Diversification does not guarantee a profit or protect against a loss. Investments in international and emerging markets securities include exposure to risks such as currency fluctuations, foreign taxes and regulations, and the potential for illiquid markets and political instability. Please see the end of this publication for more disclosures.
Important Disclosure Information:
The comments above refer generally to financial markets and not RiverFront portfolios or any related performance. Opinions expressed are current as of the date shown and are subject to change. Past performance is not indicative of future results and diversification does not ensure a profit or protect against loss. All investments carry some level of risk, including loss of principal. An investment cannot be made directly in an index.
Information or data shown or used in this material was received from sources believed to be reliable, but accuracy is not guaranteed.
This report does not provide recipients with information or advice that is sufficient on which to base an investment decision. This report does not take into account the specific investment objectives, financial situation or need of any particular client and may not be suitable for all types of investors. Recipients should consider the contents of this report as a single factor in making an investment decision. Additional fundamental and other analyses would be required to make an investment decision about any individual security identified in this report.
The comments above are subject to change and are not intended as investment recommendations. There is no representation that an investor will or is likely to achieve positive returns, avoid losses or experience returns as discussed for various market classes.
Chartered Financial Analyst is a professional designation given by the CFA Institute (formerly AIMR) that measures the competence and integrity of financial analysts. Candidates are required to pass three levels of exams covering areas such as accounting, economics, ethics, money management and security analysis. Four years of investment/financial career experience are required before one can become a CFA charterholder. Enrollees in the program must hold a bachelor’s degree.
All charts shown for illustrative purposes only. Technical analysis is based on the study of historical price movements and past trend patterns. There are no assurances that movements or trends can or will be duplicated in the future.
Stocks represent partial ownership of a corporation. If the corporation does well, its value increases, and investors share in the appreciation. However, if it goes bankrupt, or performs poorly, investors can lose their entire initial investment (i.e., the stock price can go to zero). Bonds represent a loan made by an investor to a corporation or government. As such, the investor gets a guaranteed interest rate for a specific period of time and expects to get their original investment back at the end of that time period, along with the interest earned. Investment risk is repayment of the principal (amount invested). In the event of a bankruptcy or other corporate disruption, bonds are senior to stocks. Investors should be aware of these differences prior to investing.
In general, the bond market is volatile, and fixed income securities carry interest rate risk. (As interest rates rise, bond prices usually fall, and vice versa). This effect is usually more pronounced for longer-term securities). Fixed income securities also carry inflation risk, liquidity risk, call risk and credit and default risks for both issuers and counterparties. Lower-quality fixed income securities involve greater risk of default or price changes due to potential changes in the credit quality of the issuer. Foreign investments involve greater risks than U.S. investments, and can decline significantly in response to adverse issuer, political, regulatory, market, and economic risks. Any fixed-income security sold or redeemed prior to maturity may be subject to loss.
Investing in foreign companies poses additional risks since political and economic events unique to a country or region may affect those markets and their issuers. In addition to such general international risks, the portfolio may also be exposed to currency fluctuation risks and emerging markets risks as described further below.
Changes in the value of foreign currencies compared to the U.S. dollar may affect (positively or negatively) the value of the portfolio’s investments. Such currency movements may occur separately from, and/or in response to, events that do not otherwise affect the value of the security in the issuer’s home country. Also, the value of the portfolio may be influenced by currency exchange control regulations. The currencies of emerging market countries may experience significant declines against the U.S. dollar, and devaluation may occur subsequent to investments in these currencies by the portfolio.
Foreign investments, especially investments in emerging markets, can be riskier and more volatile than investments in the U.S. and are considered speculative and subject to heightened risks in addition to the general risks of investing in non-U.S. securities. Also, inflation and rapid fluctuations in inflation rates have had, and may continue to have, negative effects on the economies and securities markets of certain emerging market countries.
Technology and internet-related stocks, especially of smaller, less-seasoned companies, tend to be more volatile than the overall market.
Index Definitions:
Standard & Poor’s (S&P) 500 Index measures the performance of 500 large cap stocks, which together represent about 80% of the total US equities market.
U.S Market Cap index information calculated based on data from CRSP 1925 US Indices Database ©2024 Center for Research in Security Prices (CRSP®), Booth School of Business, The University of Chicago. Used as a source for cap-based portfolio research appearing in publications, and by practitioners for benchmarking, the CRSP Cap-Based Portfolio Indices Product data tracks micro, small, mid- and large-cap stocks on monthly and quarterly frequencies. This product is used to track and analyze performance differentials between size-relative portfolios. CRSP ranks all NYSE companies by market capitalization and divides them into ten equally populated portfolios. Alternext and NASDAQ stocks are then placed into the deciles determined by the NYSE breakpoints, based on market capitalization. The series of 10 indices are identified as CRSP 1 through CRSP 10, where CRSP 10 has the largest population and smallest market-capitalization. CRSP portfolios 1-2 represent large cap stocks, portfolios 3-5 represent mid-caps and portfolios 6-10 represent small caps.
MSCI EAFE Index NR is designed to represent the performance of large and mid-cap securities across 21 developed markets, including countries in Europe, Australasia, and the Far East, excluding the US and Canada. Net total return indices reinvest dividends after the deduction of withholding taxes, using (for international indices) a tax rate applicable to non-resident institutional investors who do not benefit from double taxation treaties.
The Real Return is the annual percentage return realized on an investment adjusted for inflation. Trend, according to Price Matters® is the slope of an exponential growth function that closely tracks a real (inflation-adjusted) long term Index for that Asset Class. Distance from Trend is the distance of the trend line relative to the current index level expressed as a percentage.
Definitions:
RiverFront’s Price Matters® discipline compares inflation-adjusted current prices relative to their long-term trend to help identify extremes in valuation.
Trend, according to Price Matters® is the slope of an exponential growth function that closely tracks a real (inflation-adjusted) long term Index for that Asset Class. Distance from Trend is the distance of the trend line relative to the current index level expressed as a percentage.
When referring to being “overweight” or “underweight” relative to a market or asset class, RiverFront is referring to our current portfolios’ weightings compared to the composite benchmarks for each portfolio.
RiverFront Investment Group, LLC (“RiverFront”), is a registered investment adviser with the Securities and Exchange Commission. Registration as an investment adviser does not imply any level of skill or expertise. Any discussion of specific securities is provided for informational purposes only and should not be deemed as investment advice or a recommendation to buy or sell any individual security mentioned. RiverFront is affiliated with Robert W. Baird & Co. Incorporated (“Baird”), member FINRA/SIPC, from its minority ownership interest in RiverFront. RiverFront is owned primarily by its employees through RiverFront Investment Holding Group, LLC, the holding company for RiverFront. Baird Financial Corporation (BFC) is a minority owner of RiverFront Investment Holding Group, LLC and therefore an indirect owner of RiverFront. BFC is the parent company of Robert W. Baird & Co. Incorporated, a registered broker/dealer and investment adviser.
To review other risks and more information about RiverFront, please visit the website at riverfrontig.com and the Form ADV, Part 2A. Copyright ©2024 RiverFront Investment Group. All Rights Reserved. ID 3384125
For more news, information, and analysis, visit the ETF Strategist Channel.