

The economy was more resilient over the course of 2023 than we had expected given the aggressive policy tightening from the U.S. Federal Reserve (Fed). Excess pandemic-era stimulus combined with additional fiscal stimulus, such as the Inflation Reduction Act and the CHIPS Act, kept demand elevated even as supply chain disruptions eased.
It’s safe to say Fed policy will dominate the 2024 news cycle again. As we stated in the past, the Fed has notoriously not been known for its nuance and recent history has been no exception. However, it is important to also recognize that regardless of the size and frequency of Fed action, the U.S. economy is the largest and most diverse economy in history, and the consequences of Fed policy changes are not instantaneous. The impact typically takes time to be fully reflected in the economy.
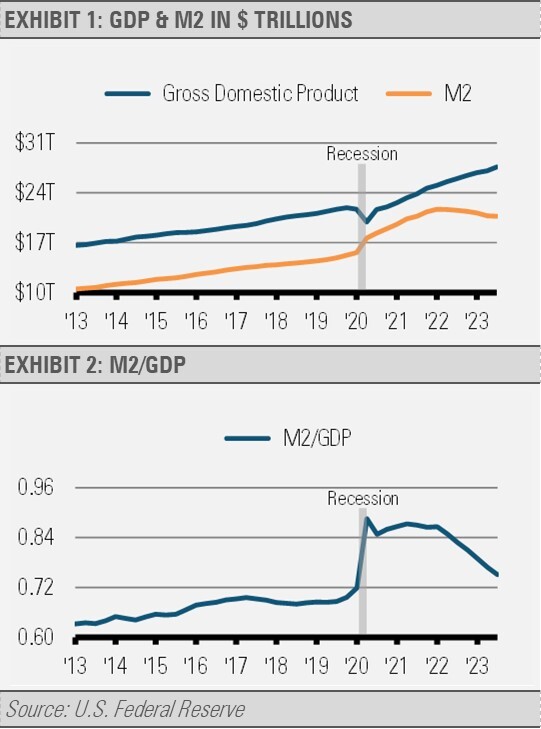
With the decrease in the growth rate of money both in absolute and relative terms, we initially forecasted a fall in inflationary pressures in 2023. In 2024, we think that inflation will continue to fall as the impact of 2023 policy decisions have yet to be fully realized and will contribute to a decline in the rate of economic growth as well. This should again lead to Fed policy adjustments, though how aggressive their changes will be remains to be seen.
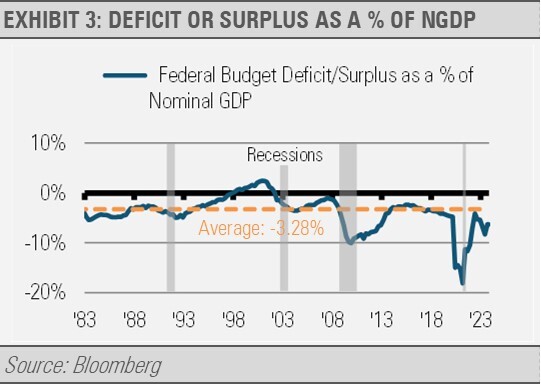
In addition to monetary policy, some of the downshift in the pace of economic growth is likely to come from a necessary reduction in government spending relative to where it has been recently. We do not think that the federal government can continue to fund such large deficits. Historically, federal deficits run around 3% of GDP annually. Today’s deficit is running closer to double that historical average, which is exceptionally large when the country is not at war or in a recession.
Deficit spending tends to increase during war time and/or in periods of economic distress, such as recessions, as the government’s counter-cyclical stabilizers kick in. These stabilizers include unemployment insurance and other federal programs that are already on the books in addition to any ad hoc programs enacted, such as the pandemic era CARES Act. However, the size of the deficit has continued well above historical norms despite the economic and market recoveries we have experienced.
Federal income tax receipts have leveled off while spending has continued to increase as shown in the following graph of quarterly tax receipts and spending (Exhibit 4). Deficit spending at today’s level is unheard of during peace time with a strong economy, as reflected in the historically low unemployment rate.
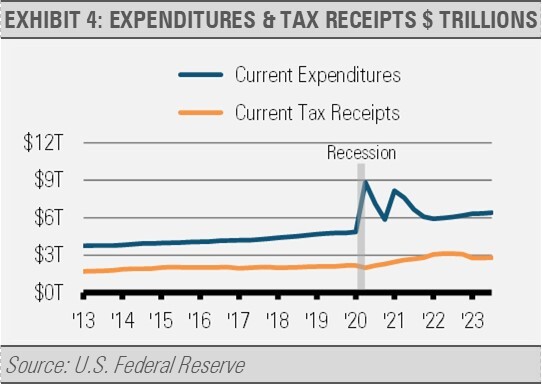
The current lack of support for additional interventions like the IRA and CHIPS Act limits the ability to further expand the deficit. Therefore, we expect deficit spending to decline in the months ahead, which is a positive step towards the goal of a more self-sustaining economy.
With excess private sector savings waning and excess government spending unlikely, we expect economic growth to continue albeit at a slower pace. Our work suggests that 2024 annualized GDP will likely fall below the recent trend to somewhere closer to 1%. Factor in slowing inflation, which looks to average below 3% for 2024, and nominal gross domestic product (NGDP) should run below 4%. Given the relationship between NGDP and corporate revenue growth, we expect revenue growth to run close to 4% for 2024. Earnings growth may be somewhat higher given falling inflationary pressures.
Therefore, we expect deficit spending to decline in the months ahead, which is a positive step towards the goal of a more self-sustaining economy.
With excess private sector savings waning and excess government spending unlikely, we expect economic growth to continue albeit at a slower pace. Our work suggests that 2024 annualized GDP will likely fall below the recent trend to somewhere closer to 1%. Factor in slowing inflation, which looks to average below 3% for 2024, and nominal gross domestic product (NGDP) should run below 4%. Given the relationship between NGDP and corporate revenue growth, we expect revenue growth to run close to 4% for 2024. Earnings growth may be somewhat higher given falling inflationary pressures.
INVESTMENT IMPLICATIONS
Following last year’s narrow equity market rally focused on a limited number of companies, we are finding significant opportunities for investors. In fact, we are seeing incredibly attractive valuations in sectors that feature more stable and consistent earnings. As a result, we are accentuating more value-oriented and defensive sectors which also happen to offer relatively strong yields. We believe these will only look more attractive with an anticipated Fed induced reduction in short-term interest rates.
2023 was one of the narrowest equity markets in 100 years. The tech bubble was the last instance of so few stocks representing such a large weighting in the S&P 500 Index. The artificial intelligence craze led the broad indices higher and dragged along many technology stocks in its wake. While some are terming this “the tech bubble of 2023”, we are not as dire on that story.
It is worth noting that technology stocks experienced a substantial correction in 2022. On a price basis from January 2022 through the end of 2023, the technology sector posted gains of roughly 10%, while the S&P 500 Index remained flat, and the equally weighted S&P 500 Index actually declined by nearly 4%.
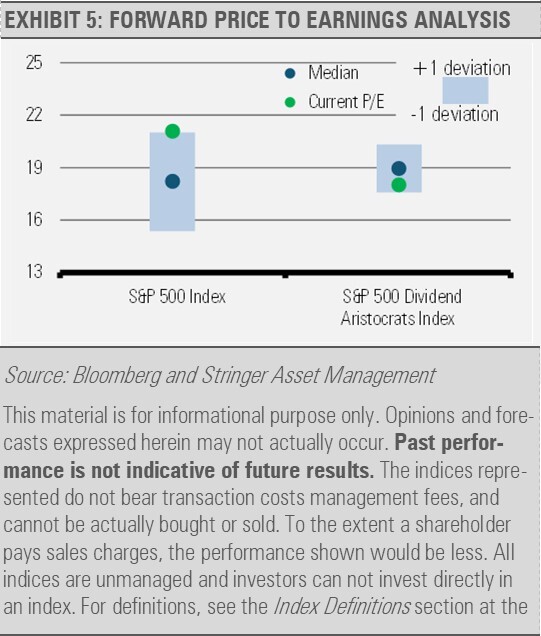
Analyzing this run from a valuation standpoint, the S&P 500 Index trades at over 21 times forward earnings, while the equally weighted version of the same 500 companies trades at less than 15 times forward earnings. In essence, for every expected dollar of earnings, the equal-weighted index trades at a 30% discount compared to the standard capitalization-weighted index.
This narrowly led equity market has left a plethora of attractively valued opportunities for us to focus on. We are happy to pay steep discounts for a dollar of expected earnings compared to those chasing the performance of the capitalization-weighted index.
In terms of our economic outlook, recent robust economic reports signal ongoing GDP growth, and the Fed’s acknowledgment of diminishing inflationary pressures suggests rate cuts in the near future broadening the path to a soft landing.
These factors led us to upgrade our U.S. economic outlook to cautiously optimistic. Just as the Fed lagged in addressing inflation, they now appear behind the curve in terms of rate cuts.
We predicted the decline in inflation based on the relationship between money growth and inflation, with inflation typically trailing changes in money growth by 12-18 months. As the excess pandemic era stimulus wanes, inflation is following the decline in money growth, prompting us to expect faster rate cuts than the Fed’s current forecast.
Investors over-allocated to money markets and T-Bills may witness a swift decline in interest income with Fed rate cuts. In contrast, those in intermediate- and longer-duration fixed income may experience more stable income alongside potential capital appreciation as interest rates decrease. We think that diversifying across fixed income maturities can be advantageous today.
In addition, investors may want to focus on other areas for income, such as dividend-paying stocks. High quality dividend payers may increase their dividend payouts over time helping to offset the eroding effects of inflation. Furthermore, high-quality dividend-paying stocks currently trade at discounts relative to their historical averages and well below the narrow group of equities that drove last year’s market gains.
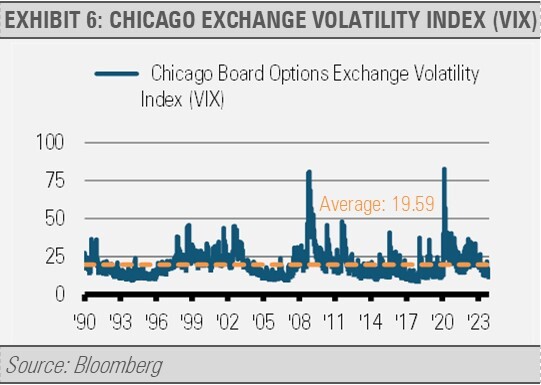
Considering the lack of market volatility as measured by the VIX, the recent calm may not persist. The current low VIX levels rank in the bottom 20% of trading days over the last 30 years. Historically, low volatility periods are followed by higher volatility, which can offer opportunities to acquire attractively priced equities. The VIX is also a critical component of our Cash indicator (CI) process that can be valuable during periods of heightened volatility.
In summary, while high money market rates may seem appealing, they carry their own risks. Diversified intermediate- and longer-duration high-quality fixed income investments offer compelling income and potential for capital appreciation. High-quality equities with dividend income potential are also attractive. With a full slate of anticipated Fed policy intervention and no shortage of headlines as election rhetoric heats up, our nimble strategic and tactical approach may make sense for those more market sensitive investors.
We are excited for the year ahead and prepared for opportunities to add value and dividend holdings in the coming months as market volatility is likely to increase. Volatility can benefit long-term investors by providing opportunities to accumulate positions at discounted levels.
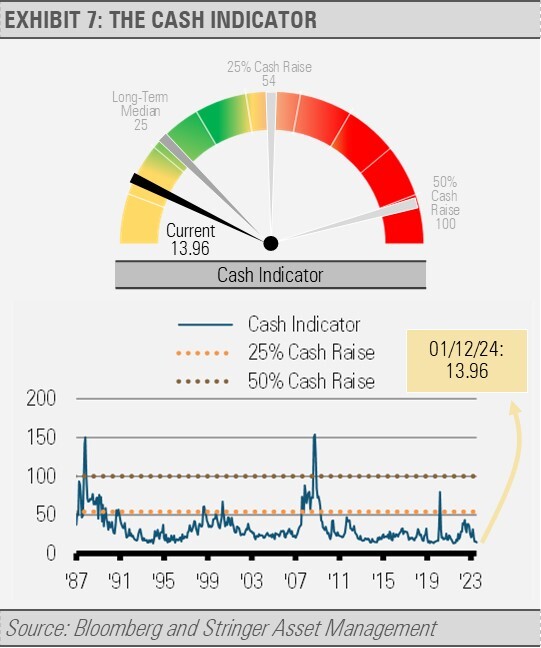
CASH INDICATOR
The Cash Indicator (CI) continues to meander near low levels that suggest financial markets are overly complacent. Especially in light of the strong market performance during the last two months of 2023, we expect equity markets to take a breather. We think that the increase in volatility that we expect will create opportunities to build positions in attractively valued equities.
DISCLOSURES
Any forecasts, figures, opinions or investment techniques and strategies explained are Stringer Asset Management, LLC’s as of the date of publication. They are considered to be accurate at the time of writing, but no warranty of accuracy is given and no liability in respect to error or omission is accepted. They are subject to change without reference or notification. The views contained herein are not to be taken as advice or a recommendation to buy or sell any investment and the material should not be relied upon as containing sufficient information to support an investment decision. It should be noted that the value of investments and the income from them may fluctuate in accordance with market conditions and taxation agreements and investors may not get back the full amount invested.
Past performance and yield may not be a reliable guide to future performance. Current performance may be higher or lower than the performance quoted.
The securities identified and described may not represent all of the securities purchased, sold or recommended for client accounts. The reader should not assume that an investment in the securities identified was or will be profitable.
Data is provided by various sources and prepared by Stringer Asset Management, LLC and has not been verified or audited by an independent accountant.
Index Definitions:
S&P 500 Index – This Index is a capitalization-weighted index of 500 stocks. The Index is designed to measure performance of a broad domestic economy through changes in the aggregate market value of 500 stocks representing all major industries.
S&P 500 Dividend Aristocrats Index – This Index tracks companies within the S&P 500 Index that have a record of raising their dividends for at least 25 consecutive years. Each company is equally weighted within the Index. S&P will remove companies from the Index when they fail to increase dividend payments from the previous year. The Index’s universe includes stocks with a float-adjusted market capitalization of at least $3 billion and an average daily trading volume of at least $5 million, in addition to consistently increasing dividend payments. The index requires a minimum of 40 companies.
For more news, information, and analysis, visit the ETF Strategist Channel.