
By Sean Clark, CFA® Chief Investment Officer, Clark Capital Management Group
In our 2020 Market Outlook, we stated a couple of concerns coming into the year including excessive short-term investor sentiment and geopolitical tensions. We believed that these risks combined with normal presidential election year trends suggested a choppy market in the first half of the year. We said, “any correction we could see given optimistic sentiment polls, expensive valuation, geopolitical risks, etc., should be short-term and replant seeds of fear for the market to again ‘climb the wall of worry’.”
Is the coronavirus the catalyst to replant those seeds of fear? It certainly looks it. As of Thursday morning, the death toll rose to 170 and confirmed cases in China soared past 7,700 people. The World Health Organization (WHO) called for a special meeting today to consider issuing an international health emergency and said that the spread of the virus outside of China is of “grave concern.”
Sentiment extremes in the market are beginning to work off as headlines related to the coronavirus and mixed results from earnings draw investor interest. On Monday, the S&P 500 declined by 1.57%, registering its first daily move of greater than 1% for the first time in 71 consecutive days (the 4th longest period since 1990).
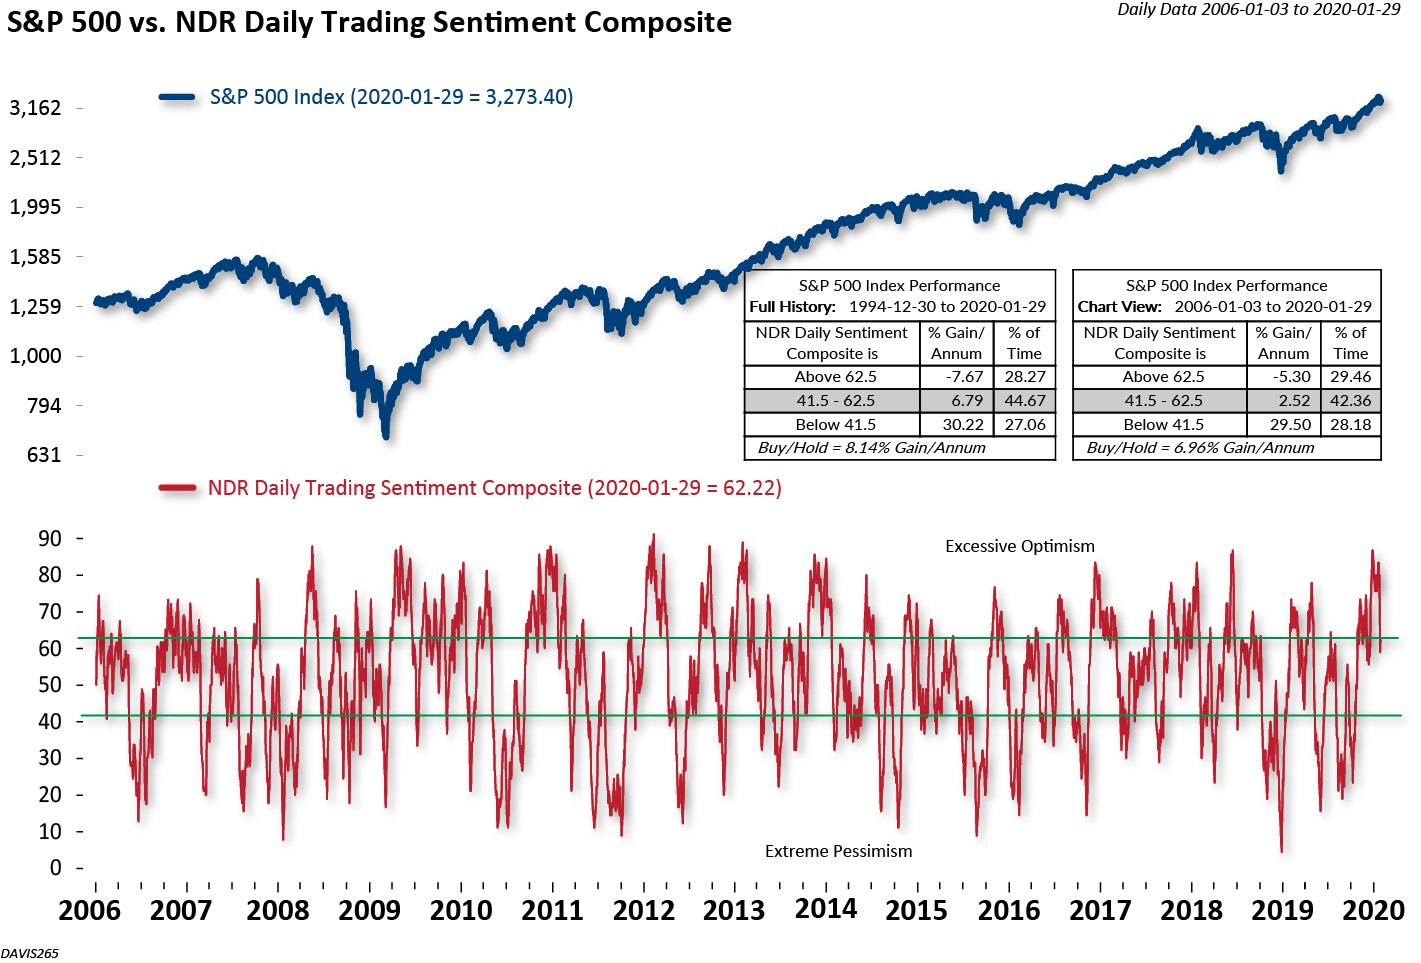
That certainly underscores our concern with investor complacency. The frothiness that we highlighted in our Market Outlook is just beginning to subside but has more to go in our opinion. For example, ETF flows have fallen just below “extreme” inflow levels, the CBOE Volatility Index (VIX) has risen, but is not at extreme levels yet, and the Ned Davis Research Trading Sentiment Composite (shown below) just moved from the excessive optimism zone into the neutral zone, and has a ways to go before entering extreme pessimism.
How have other health epidemics affected the markets? The below chart posted on MarketWatch.com shows that the MSCI World Index has gained an average 0.4% in the month after an epidemic, 3.1% in the ensuing six-month period, and 8.5% a year later. In fact, data shows that the markets normally bottom around the time that the World Health Organization (WHO) declares a health emergency. They have not done that yet, but as noted earlier, they have convened a meeting to discuss their response to the virus.

One example to look at is the SARS outbreak in 2002-2003, another respiratory illness that originated in China that infected over 8,000 and killed almost 800 people (mostly in China and Hong Kong). During the SARS outbreak, the WHO issued a global alert on March 12, 2003. The S&P 500 bottomed the day before the WHO issued a heightened global health alert and the MSCI World Index bottomed that day of the WHO announcement.
Today’s headlines are scary and are likely to get even worse if we follow along the path of prior episodes. As far as the market goes, we will watch for an internal oversold condition and washed out sentiment statistics that would suggest the market has appropriately priced in the fears. We are getting there, but may need a little more time.
The MSCI World Index captures large and mid cap representation across 23 Developed Markets (DM) countries*. With 1,646 constituents, the index covers approximately 85% of the free float-adjusted market capitalization in each country.
