

Economic Overview
Amidst signs of a cooling economy buoyed by waning inflationary pressures, a still-robust labor market continues to underpin the “no-landing” thesis. While third-quarter corporate earnings reports would seem to suggest tepid revenue growth and a fair amount of margin pressure, equity markets remain fully valued. Also, bond yields have surged, accompanied by rising interest rate volatility. The market appears to have done the Fed’s job for it, and may lead to an extended pause by the FOMC.
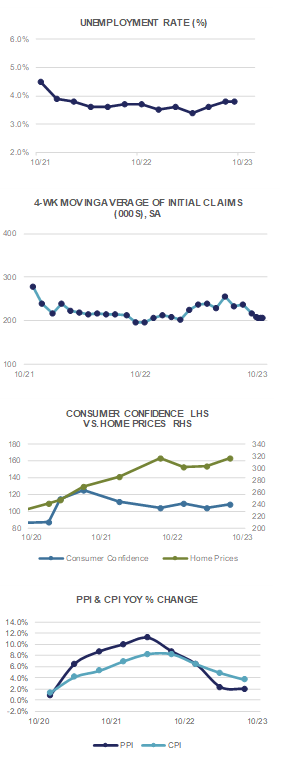
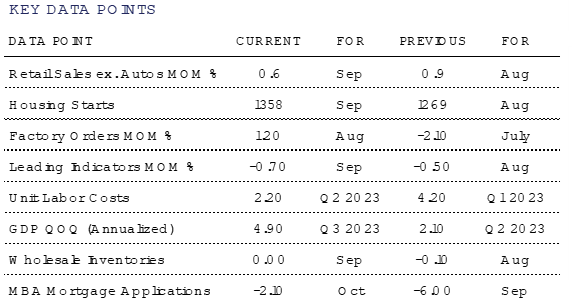
As to the economy, Q3 GDP came in at a stronger than-expected +4.9% YoY, with Personal Consumption up by 4.0%. With the U.S. consumer representing approximately 2/3 of the U.S. economy, we continue to think the odds for a hard landing remain slim as long as employment holds up.
The latest ISM Manufacturing reading for October came in below expectations at 46.7, suggesting a contraction in that area is underway. The ISM Employment reading fell below consensus at 46.8 while the ISM New Orders survey also missed the mark at 45.5. In contrast to manufacturing, the preliminary reading of the October S&P Global US Services PMI report came in at 50.9, suggesting a marginally expanding services sector.
Inflation remains sticky, although at a far lower level than a year ago. CPI for September rose +0.4% MoM (+4.1% YoY), while ex-food & energy, consumer inflation rose +0.3% MoM and +3.7% YoY. At the wholesale level, prices rose +0.5% MoM and +2.2% YoY. Stripping out the volatile food and energy sectors, prices rose +0.3% MoM and +2.7% YoY.
The Federal Reserve concluded its meeting as we go to press and they left short-term interest rates unchanged. As mentioned, the marketplace has seen bond yields rise by 100 basis points over the past couple of months, effectively doing the FOMC’s job for them. All eyes and ears will be on the language in the meeting statement, determining whether the Fed is done for good, or whether this is just a temporary pause in the upward trajectory of interest rates.
Domestic Equity
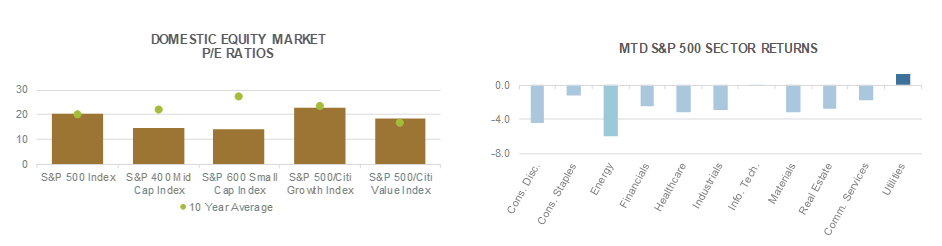
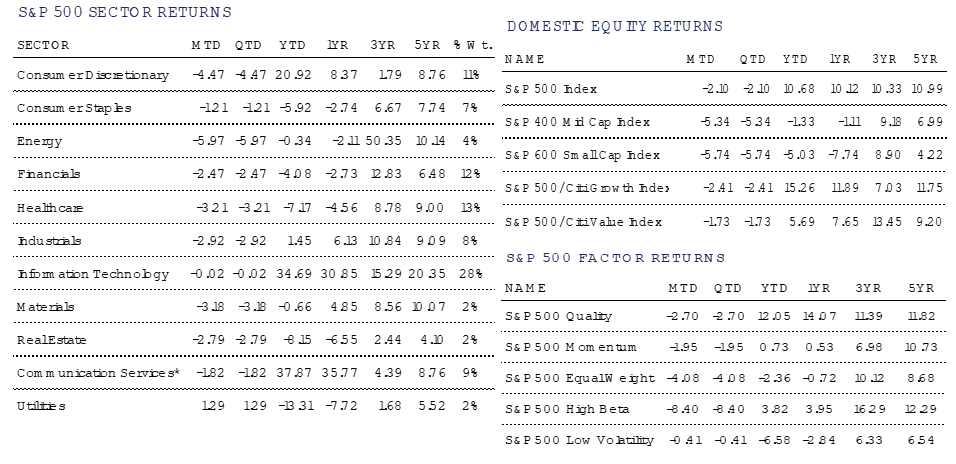
U.S. equities declined in October, with the benchmark S&P 500 Index falling -2.1% to close at 4,194. With October’s decline, Large-Caps have shed -8.3% over the trailing 3 months, landing the S&P 500 slightly below its 200 day moving average. Higher bond yields have largely been the culprit, as U.S. economic growth has remained robust. Three themes our Team has been focused on include 1) the health of the consumer; 2) the state of the economy with higher rates; and 3) earnings (both the 2024 outlook, and whether the Magnificent 7 earnings justify their lofty valuations). To those points, retail sales rose sharply in September, Q3 GDP was a blowout at +4.9% on an annualized rate, and S&P 500 earnings season has been better than expected thus far, with earnings growth largely coming in above consensus. Within the earnings picture, the Magnificent 7 earnings have been mixed. Microsoft and Amazon earnings were strong, Google and Tesla were weaker than expected, Meta was mixed, and Apple reports 11/2. Perhaps not surprisingly, their share prices reacted accordingly. Taken together, the fundamental growth outlook for the economy has remained strong and earnings from the rest of the market have been better than feared. However, inflation has been a bit sticker than anticipated, keeping bond yields elevated.
Moreover, this trend of SMID-cap underperformance can be underscored by the concentration of the S&P 500. Dubbed the Magnificent 7 (Apple, Microsoft, Amazon, Google, Meta, Tesla, &, NVIDIA), these stocks represent nearly 1/3 of the S&P 500’s market capitalization, and trade at a significant premium to the market. Put differently, the average stock trades under 16x forward earnings, in line with its historical average. This can be seen in the performance of the S&P 500 Equal Weight Index, which lost –4.1% in October, and has shed –11.8% in the last three months. Taken together, the underperformance of SMID-Caps looks a bit more “average” compared to the rest of the S&P 500, not the Magnificent 7.
Higher interest rates have put a damper on Small- and Mid-Cap equities, as measured by the S&P 600 and 400 Indices, respectively. Despite robust underlying economic data, SMID-Cap indices have been hit hard, falling –5.7% and –5.3% apiece during the period. Over the trailing three month period, Small- and Mid-Caps have shed –15.1%, and –12.9%, respectively, underperforming the S&P 500. While SMID-caps may be more rate sensitive than Large-Caps due to their concentration in Financials (i.e. 25% of the S&P 600) and shorter maturities of debt outstanding when compared to Large-Caps, their current valuations likely discount those factors and then some. The S&P 600 for instance trades under 12x earnings for 2024, a significant discount to Large-Caps and to history.
International Equity
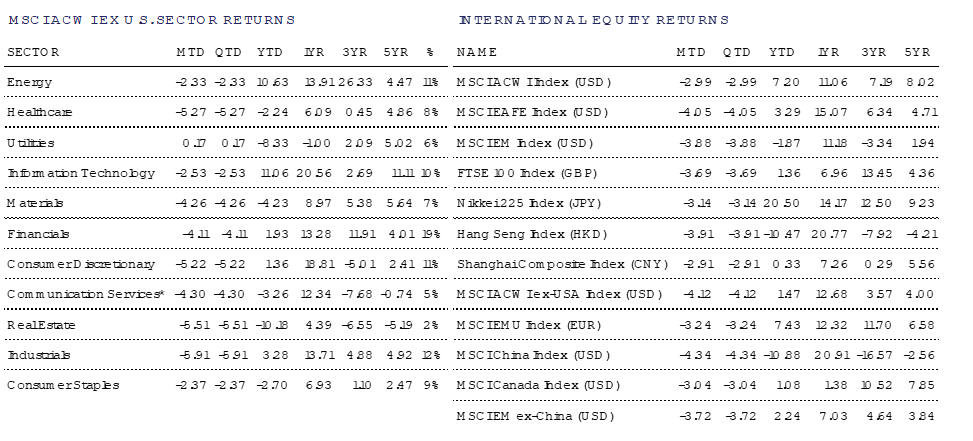
While conflicts in the Middle East dominated headlines, international markets experienced continued weakness during the month of October. Developed Markets (DM), as measured by the MSCI EAFE Index fell -4.1% while Emerging Markets (EM), as measured by the MSCI EM index, saw a drop of -3.9% (both in USD terms).
Japanese investors saw the month of October come to a close with the announcement from its central bank that it would be more flexible in how it managed government bond yields. The central bank announced a policy that would use 1 percent as a starting point for yields on 10-year government bonds, a level that was previously the cap. Following years of ultra-low interest rates in an effort to spur economic growth, those rates are now well out of step with other major economies. The central bank is certainly in a tough situation as they try to thread the needle of strengthening their currency by allowing rates to move higher while not enforcing unsustainable borrowing costs on Japan’s businesses. During the month of October, the Nikkei 225 Index fell -3.1% (in JPY terms).
In local currency terms (EUR), the MSCI Europe index fell -3.2% during the month with just 3 of 16 countries contributing positively to pan-European equity returns. After increasing interest rates 10 consecutive times, the European Central Bank left its key rate unchanged at 4.0% while reiterating that maintaining this level for a longer period would help bring down inflation to their 2.0% target. ECB president Christine Lagarde made mention that previous rate hikes were already making their way into the European Economy, noting that it was “weak” and would remain that way for the rest of this year.
There still seems to be signs of the Chinese economy slowing with the official purchasing manager’s index for the manufacturing sector falling to 49.5 in October, down from 50.2 in September. A reading above 50 indicates expansion activity while a reading below 50 represents a contraction. Investors in Chinese companies saw a tumultuous start to the month with strength building near the end after the Chinese government authorized the issuance of 1 trillion yuan (~$137 billion USD) in government bonds to be used for reconstruction of areas hit hard by natural disasters. On the month, the MSCI China Index fell -4.3% (in USD terms).
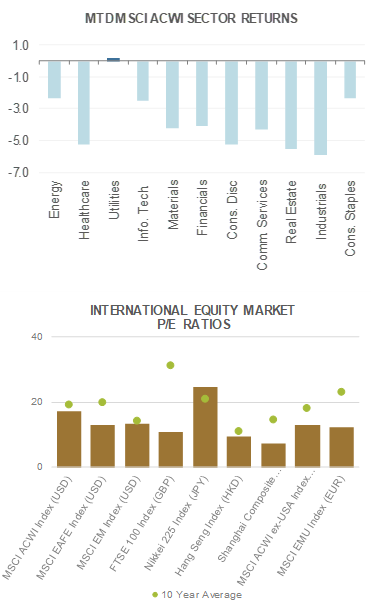
Ten of the eleven MSCI ACWI ex-U.S. sectors posted negative returns during October, with the lone gainer being Utilities (+0.17%). An overall risk-off tone was felt by international market participants as bond yields moved higher and geopolitical conflict was elevated.
Fixed Income
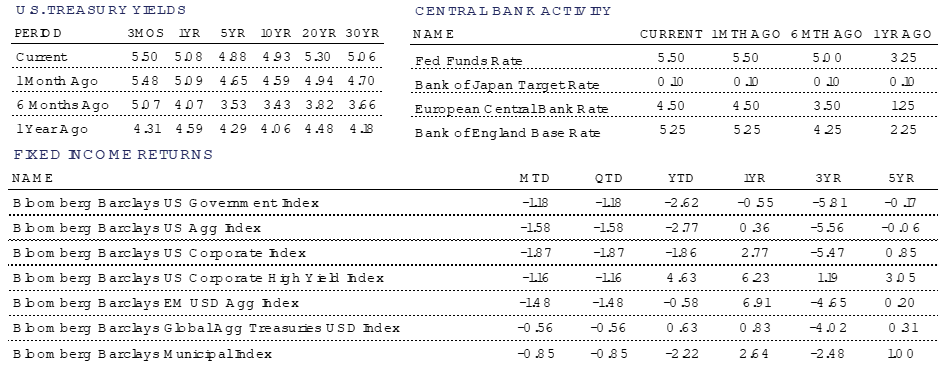
The reverberations of the Federal Reserve’s aggressive Dot Plot chart (released on September 20th) continued to affect the Treasury yield curve through the month of October. Yields were roughly flat out to 2 years, but moved gradually higher as you move out the curve from there, with 3 year yields rising by over 10 bps, 5 years yields rising almost 25 bps, 10 year yield by 35 bps, and 30 year yields increasing close to 40 basis points.
The Federal Reserve’s October meeting concluded today, and the statement released announces that the Federal Funds Rate will maintain its target of 5.25% to 5.5%, while indicating some concern over the sharp move higher in yields. At the following press conference, Powell said that, “Given how far we have come along with the uncertainty and risks we face, the committee is proceeding carefully.” In other recent public comments, Powell has highlighted his humility in addressing the very difficult job of attempting to normalize inflation while not inflicting outsized economic pain.
Bonds faced broad downward pressure in October, with prices moving lower as interest rates moved higher. The Government Bond Index was down -1.18% dues to these pressures.
The Investment Grade Corporate Bond Index declined more significantly, falling -1.87% in the month. This was driven by Investment Grade Corporate bond yield spreads widening, increasing yields further and exacerbating the negative price impact inflicted by the Treasury yield curve movement.
The U.S. Corporate High Yield Index was down -1.16%, even as credit spreads in this market expanded. The negative impact of the spread widening and yield curve movement were ameliorated by the shorter Duration of the High Yield Index and partially offset by the higher income that this riskier allocation provides.
Tax-free Municipal bonds bounced back this month. Although they were down -0.85%, Municipal bonds were one of the better performers in the month of October. Shorter maturities remain a bit expensive relative to history, while longer dated maturities offer better value.
Alternative Investments
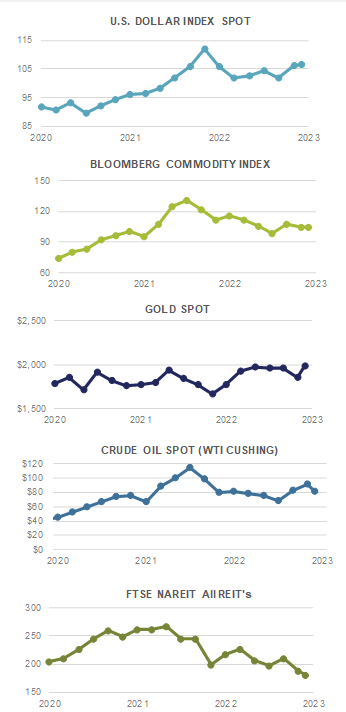
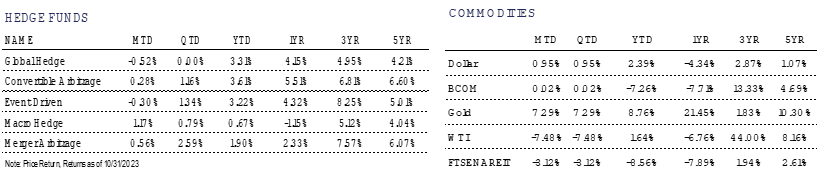
Alternative investments had mixed results in October. Broad commodities, as measured by the Bloomberg Commodity Index, finished the month roughly flat in terms of performance.
Gold was a standout performer among alternatives, gaining +7.3% during the month. The metal’s value as a portfolio diversifier was highlighted in a month when both global equities and fixed income broadly declined. Often viewed as a safe-haven asset and way to protect against market volatility, gold performed well in the face of renewed geopolitical issues, mainly the start of the Israel-Hamas War. The strong performance also occurred despite the continued rise in interest rates.
Oil continued its recent volatile performance, with WTI Crude Oil declining -7.5% in October. Many market forecasters are worried about the possibility of the Israel-Hamas War spreading into a wider Middle East conflict which could throw the world’s most important regional oil market into a period of flux. However, oil prices remain relatively subdued for now with mixed demand signals, as Chinese manufacturing fell back into contraction last month while the U.S. consumer remains strong.
The U.S. energy landscape saw a shakeup in October as both Exxon and Chevron, the largest American energy companies, announced historic acquisitions. Exxon agreed to purchase Pioneer Natural Resources Co. for $60 Billion and Chevron agreed to buy Hess Corp. for $53 Billion. Both purchases appear to be an attempt to hold off competitors and lock up control of resources, cementing their status as crude output leaders for future decades.


For more news, information, and analysis, visit the ETF Strategist Channel.