

SUMMARY
2022 begins as 2021 ended, with the upward sloping price trends for Large Cap indices in place. Not so for Small Caps and many individual stocks. These areas are key ingredients in determining whether many internal measuring tools improve/confirm at the start of 2022.
OVERBOUGHT VERSUS NEW YEAR INFLOWS
In terms of discerning equity market tops, following various Advance/Decline Lines (A/D Line) can be a value-added exercise. Consistent with A/D Line analysis, and in putting 2021 behind us and starting fresh in 2022, I can make the following observations:
- S&P 500 and S&P Mid-Cap A/D Lines recorded a new high near the end of December. This is bullish/supportive of Large Caps and, to a lesser degree, Mid-Caps. Figure 1.
- All issues and common-stock-only NYSE A/D Lines did not come close to recording a new high in mid-November, December, or on 1/3/22, when both the S&P 500 and DJIA recorded a new closing high. The longer this negative non-confirmation lasts, the more problems it may lead to in terms of a deeper price correction or drawn-out time correction, especially if support levels are violated. Figure 2.
- The S&P Small Cap A/D Line and Small Cap relative strength line versus Large Caps continues to be a “problem child” for the domestic equity market. Strength/participation in this area would go a long way in bolstering the bullish case for the broad market. Figure 3.
Near-term, the conundrum facing Wall Street as 2022 begins is how to balance an overbought condition and defensive sectors outperforming in December, leading to a market pause/decline, and “New Year inflows,” which are supportive of equities short-term. Plus, many individual stocks that were crushed in 2021 may be stabilizing in an early base-building phase. Please reach out for specifics about the overbought condition.
It is too soon to tell whether the overbought condition or new inflows will prevail. In the meantime, the NDR Catastrophic Stop Loss Model remains on a buy signal, and there is a Large Cap Stock-Bond relative strength trend favoring Large Cap stocks over fixed income. However, it would be prudent to discern risk parameters at the start of a new year while also using support and resistance levels in accordance with your clearly defined risk parameters. Figures 4-7.
Figure 1: S&P 500 Large Cap and S&P Mid Cap Advance Decline Lines. | This bodes well for Large Caps and to a lesser degree Mid-Caps.
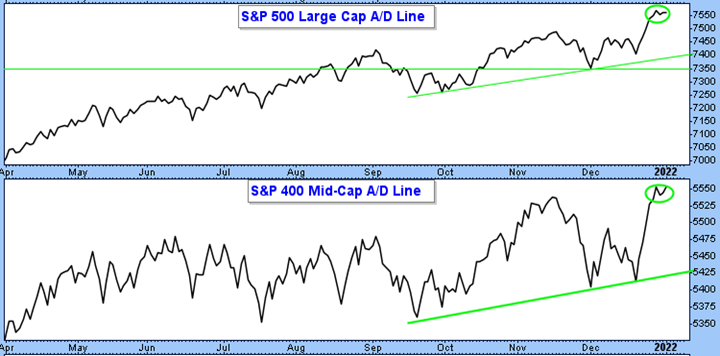
Figure 2: NYSE Advance Decline Lines (all issues and common stock only). | While moving in the right direction, which is encouraging in itself, the negative non-confirmations are apparent. This will be especially telling if equity market indices violate support.
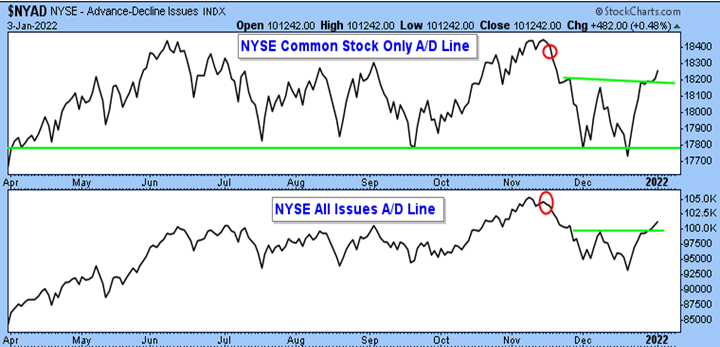
Figure 3: S&P 600 Small Cap Advance Decline Line (upper frame) and relative strength trend (lower frame). | While slowly moving in the right direction, at least for now, more work is needed here. This is a “canary in the coalmine” because the Small Cap complex plays a big role in many internal equity market measuring tools.
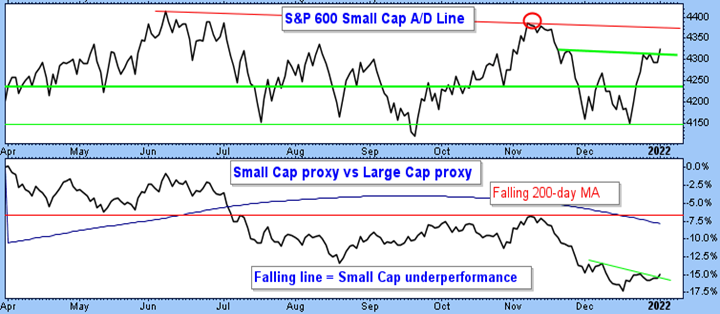
Figure 4: S&P 500 Large Cap Index Daily (SPX). | With resistance depicted by the red lines, support in the area between 4744 and 4700+/- should contain at least the first drawdown attempt.
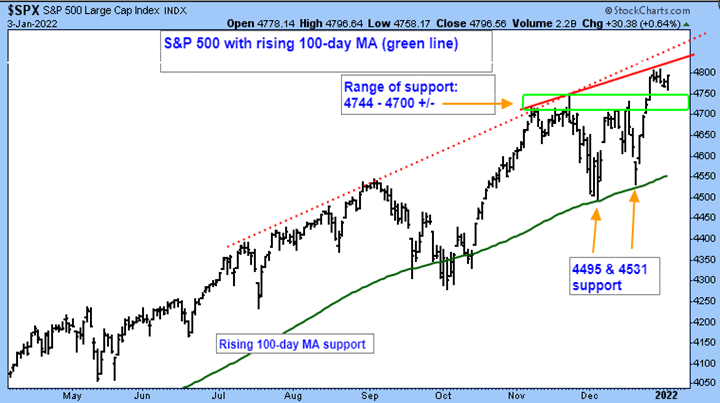
Figure 5: S&P 500 Large Cap Index 1-hour (SPX). | Current trading range with numerous levels/a range of support—green box and circles. Very short-term resistance is depicted by the red horizontal line.
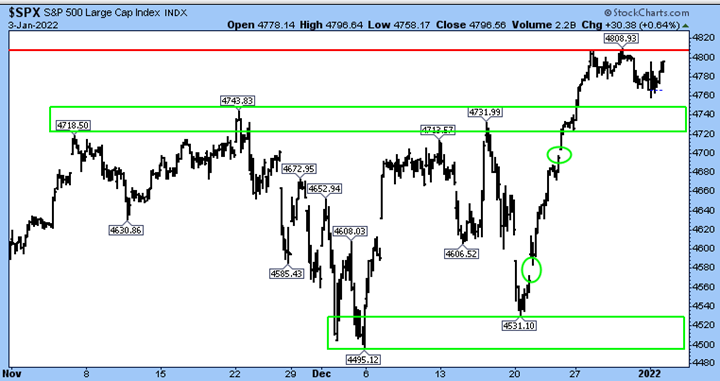
Figure 6: iShares Russell 2000 ETF (Small Cap proxy). | This rallied right off support (orange arrow). Now I would like to see a move above resistance (blue arrows), ideally on a closing basis.
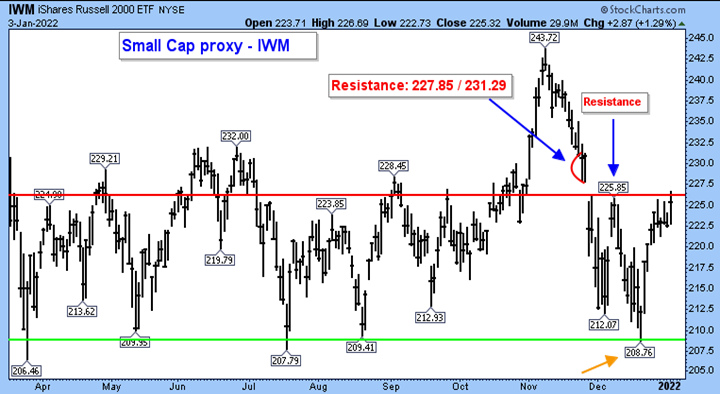
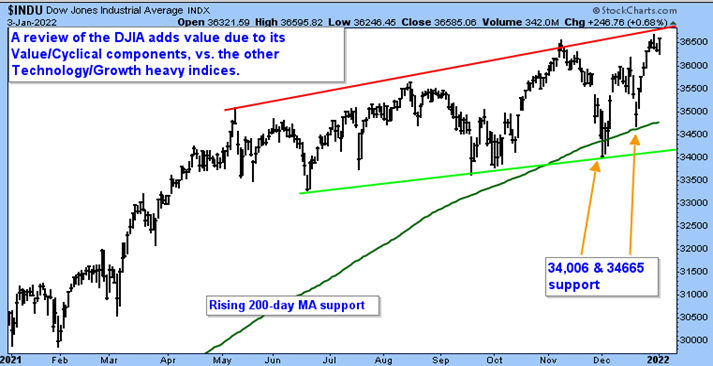
Figure 7: Dow Jones Industrial Average Daily (INDU). | As the upper end of the channel is approached (resistance), the closing high set on 1/3/22 was not confirmed by either NYSE A/D Line. This will take on added importance if support is broken before this negative non-confirmation is favorably resolved.
IMPORTANT CHARTS FOR 2022
I will do a more extensive review during my Chart Jamboree online event (registration required) on 1/18/22.
Figure 8: Growth versus Value – Large Cap, Mid-Cap, and Small Cap. | Stay with the prevailing trend, and when it changes, act accordingly. For now, I suggest: Large Cap Value as long as this ratio remains below the red horizontal line and/or the upward sloping red line, and Mid-Cap Value. In the Small Cap space, I am “neutral,” meaning have positions in both. Being properly positioned in this space may add tremendous alpha in 2022.
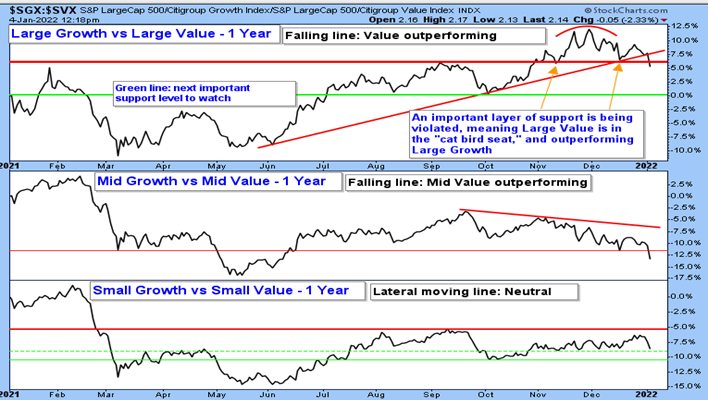
Figure 9: CBOE 10-Year U.S. Treasury Yield Index (TNX/16.28 = 1.628%). | “Home on the range” (rangebound) until proven otherwise. This chart, and a chart of real interest rates, will be “canaries in the coal mine” as we move through 2022. Don Hagan recently tweeted about real interest rates. Please reach out for specifics or follow him on Twitter. “Real interest rate is one that has been adjusted for inflation, reflecting the real cost of funds to the borrower and the real yield to the lender.”

Day Hagan Asset Management appreciates being part of your business, either through our research efforts or investment strategies. Please let us know how we can further support you.
Art Huprich, CMT®
Chief Market Technician
Day Hagan Asset Management
—Written 1.02-03.2022. Chart and table source: Stockcharts.com unless otherwise noted.
UPCOMING EVENTS
- Day Hagan Technical Analysis with Art Huprich, CMT, on January 18, 2022, at 4:15 p.m. ET
- Day Hagan/Ned Davis Research Smart Sector 2021 Review and NDR Catastrophic Stop Update with Art Day, on January 13, 2022, at 1:15 p.m. ET
- Day Hagan/Ned Davis Research Smart Sector 2021 Review and NDR Catastrophic Stop Update with Art Day, on January 13, 2022, at 4:15 p.m. ET
Day Hagan Market Update with Donald Hagan, CFA, on February 9, 2022, at 4:15 p.m. ET
For more news, information, and strategy, visit the ETF Strategist Channel.
Disclosure: The data and analysis contained herein are provided “as is” and without warranty of any kind, either express or implied. Day Hagan Asset Management (DHAM), any of its affiliates or employees, or any third-party data provider, shall not have any liability for any loss sustained by anyone who has relied on the information contained in any Day Hagan Asset Management literature or marketing materials. All opinions expressed herein are subject to change without notice, and you should always obtain current information and perform due diligence before investing. DHAM accounts that DHAM or its affiliated companies manage, or their respective shareholders, directors, officers and/or employees, may have long or short positions in the securities discussed herein and may purchase or sell such securities without notice. The securities mentioned in this document may not be eligible for sale in some states or countries, nor be suitable for all types of investors; their value and income they produce may fluctuate and/or be adversely affected by exchange rates, interest rates or other factors.
Investment advisory services offered through Donald L. Hagan, LLC, a SEC registered investment advisory firm. Accounts held at Raymond James and Associates, Inc. (member NYSE, SIPC) and Charles Schwab & Co., Inc. (member FINRA, SIPC). Day Hagan Asset Management is a dba of Donald L. Hagan, LLC.