
Happy New Year! The calendars may be turning over but remember that markets do not follow the calendar year. Investing is a lifelong endeavor.
That being said, investing does have some seasonal patterns. The last week of the year is typically one of the lowest volume weeks for the market, meaning the fewest number of shares change hands. This was true for 2023. Last week was the lowest average volume week that the market saw all year long.
Now, as we head into the new year, we expect markets to become “interesting.”
Parabolic Moves Happen in Both Directions
What makes this market “interesting?” Well to begin, markets just experienced a parabolic advance to end the year. This advance was preceded by a -10%+ decline that occurred beginning in August and last through the end of October. The advance led to many stocks becoming “overbought” or having come too far, too fast. Neither the decline in the market nor the advance was very rational. To quote a famous technician and analyst, Bob Farrell, “excesses in one direction will lead to an opposite excess in the other direction.”
Sentiment
As we head into 2024, investor sentiment favors the bulls, but that might not be a positive. The most recent Investor Sentiment Survey, published by the American Association of Individual Investors, showed that nearly 50% of investors surveyed were bullish, while only 25% were bearish. Two weeks prior, bearish sentiment hit a six-year low. Sentiment is a contrarian indicator, meaning that most investors feel optimistic near the market peaks, and most pessimistic at troughs. As Bob Farrell also says, “the public buys most at the top and least at the bottom.”
Technology Stocks
Technology stocks benefited most in 2023. Mega cap tech stocks, such as those in the “Magnificent 7,” saw significant advances after suffering the most in 2022. One technician that our team follows is David Wozniak (CMT). In his most recent newsletter, he wrote:
“Portfolios that are overweighted in the big tech stocks might reduce holdings to include lower P/E names. Selling may have been pushed off in the magnificent seven stocks until the new year to avoid 2023 capital gain taxes. A New Year selloff in big tech is possible.”
Our team agrees with David’s statement. From a charting perspective, a few of the big technology names are at or near resistance levels. It would not be surprising to see them pullback off resistance levels.
Chart of the Week
For 2024, our team at Canterbury will begin featuring a chart of the week. These charts may look at a sector or industry, country, or individual security. The goal of highlighting these charts is to observe some technical characteristics developing within each chart.
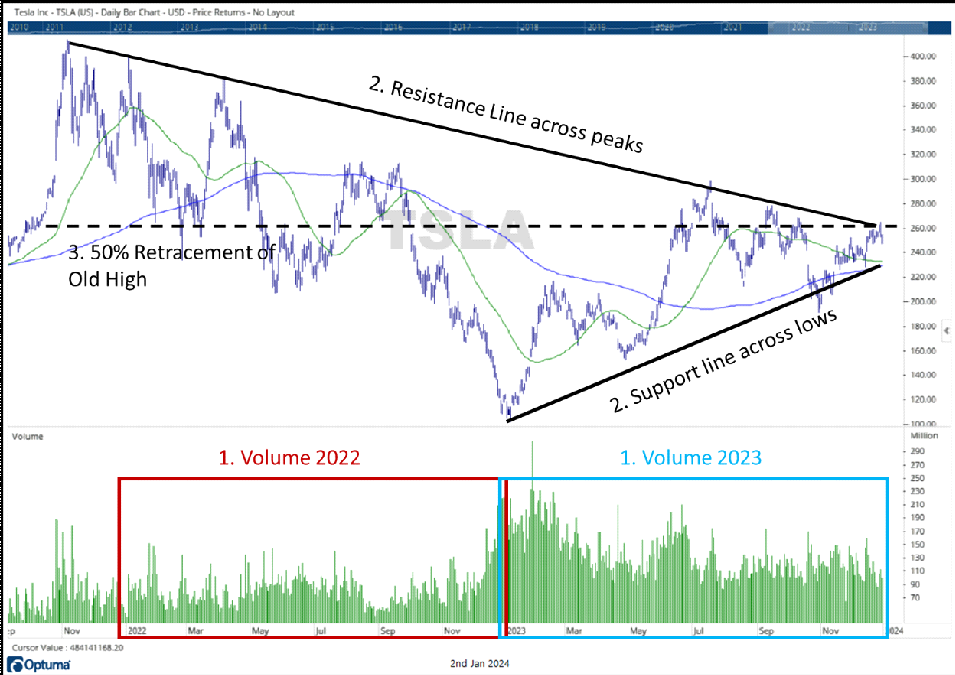
This week, we’ll focus on Tesla (TSLA), which is the 8th largest stock in the S&P 500. In 2023, Tesla had the highest trading volume among all S&P 500 stocks. This implies that Tesla shares were bought and sold more frequently than those of any other stock in the index last year. To put it in perspective, Tesla’s total trading volume for 2023 was more than double that of the stock with the second-highest volume in the S&P 500 (which was AMD, followed by Apple and Amazon). Tesla’s trading volume in 2023 was 1.57x larger than it was in 2022.
According to Investopedia, the average holding period for a stock is about 5.5 months (calculated by dividing the outstanding shares by the stock’s average daily trading volume). Apple, the largest S&P 500 stock, as an example, has an average investor holding period of just over one year. Tesla, on the other hand, had an average investor holding period of 23 trading days in 2023.
Buyers and sellers are currently at a point of interest in this highly traded, often volatile stock.
Source: Chart created by Canterbury Investment Management using Optuma Technical Analysis Software
Chart highlights
- As stated above, Tesla had very high trading volume in 2023 compared to 2022. Over the last two years, the stock has ranged from $400 per share to $100 per share. The stock has had high volatility and investors have held it for short periods of time on average. In other words, Tesla’s stock has no idea where it wants to be and has been a rather speculative investment.
- The battle between Supply and Demand is converging. Tesla has put in a series of lower highs and higher lows, forming a triangular pattern. In other words, the stock’s trading range has gotten tighter. Eventually, either buyers or sellers will win out, and the stock will break out of the pattern in one direction or the other.
- The upper end of the triangular pattern is around $260. This price is a 50% retracement of the old high from 2021. This adds to the significance of the $260 resistance level.
- The price convergence occurs at a 50% Fibonacci retracement level. Without going into detail, this level increases the current price’s significance.
- Over the last 3 months, there has been more average volume on “up” days than there has been average volume on “down” days. Perhaps there is more conviction to the upside.
What should investors be watching for with Tesla? As the battle between supply and demand narrows, the stock becomes increasingly likely to break out either up or down. Investors should watch for a break of upper resistance or lower support, particularly if it occurs on higher volume. The $260 price level appears to be a significant point of resistance because it also happens to be a 50% retracement level. Breaking above this level, on high volume, would likely provide some positive momentum. Right now, in the short term, buyers are in control as most of the volume has been on the upside.
Bottom Line
Markets could be shaky to begin the new year. Most indexes just experienced a sharp advance that began at the news of falling inflation numbers and the possibility of the Fed lowering interest rates. News like this will often create noise, particularly in a volatile market. Any negative news would likely spark an overreaction in the opposite direction. Markets could see some selling out of the technology sectors, which far outpaced every other sector in 2023. Overall, this remains a risky environment.
For more news, information, and strategy, visit the ETF Strategist Channel.
