
By Rob Williams, Chief Investment Strategist
The last four quarters have been difficult for active fixed income investors. We’ve seen the swiftest Fed rate hiking cycle in history, and we’ve navigated through the fits and starts of when the cycle would wind down. The good news is that we are almost there. We’re currently in a pause period, where the Fed is weighing economic data to determine how much longer rates will need to be held at these levels before starting to ease. Historically, we are entering a good return period for fixed income, but we believe it’s important to have an active manager to make decisions about which levers will generate excess alpha as we near the end of the cycle.
The Fed Pauses
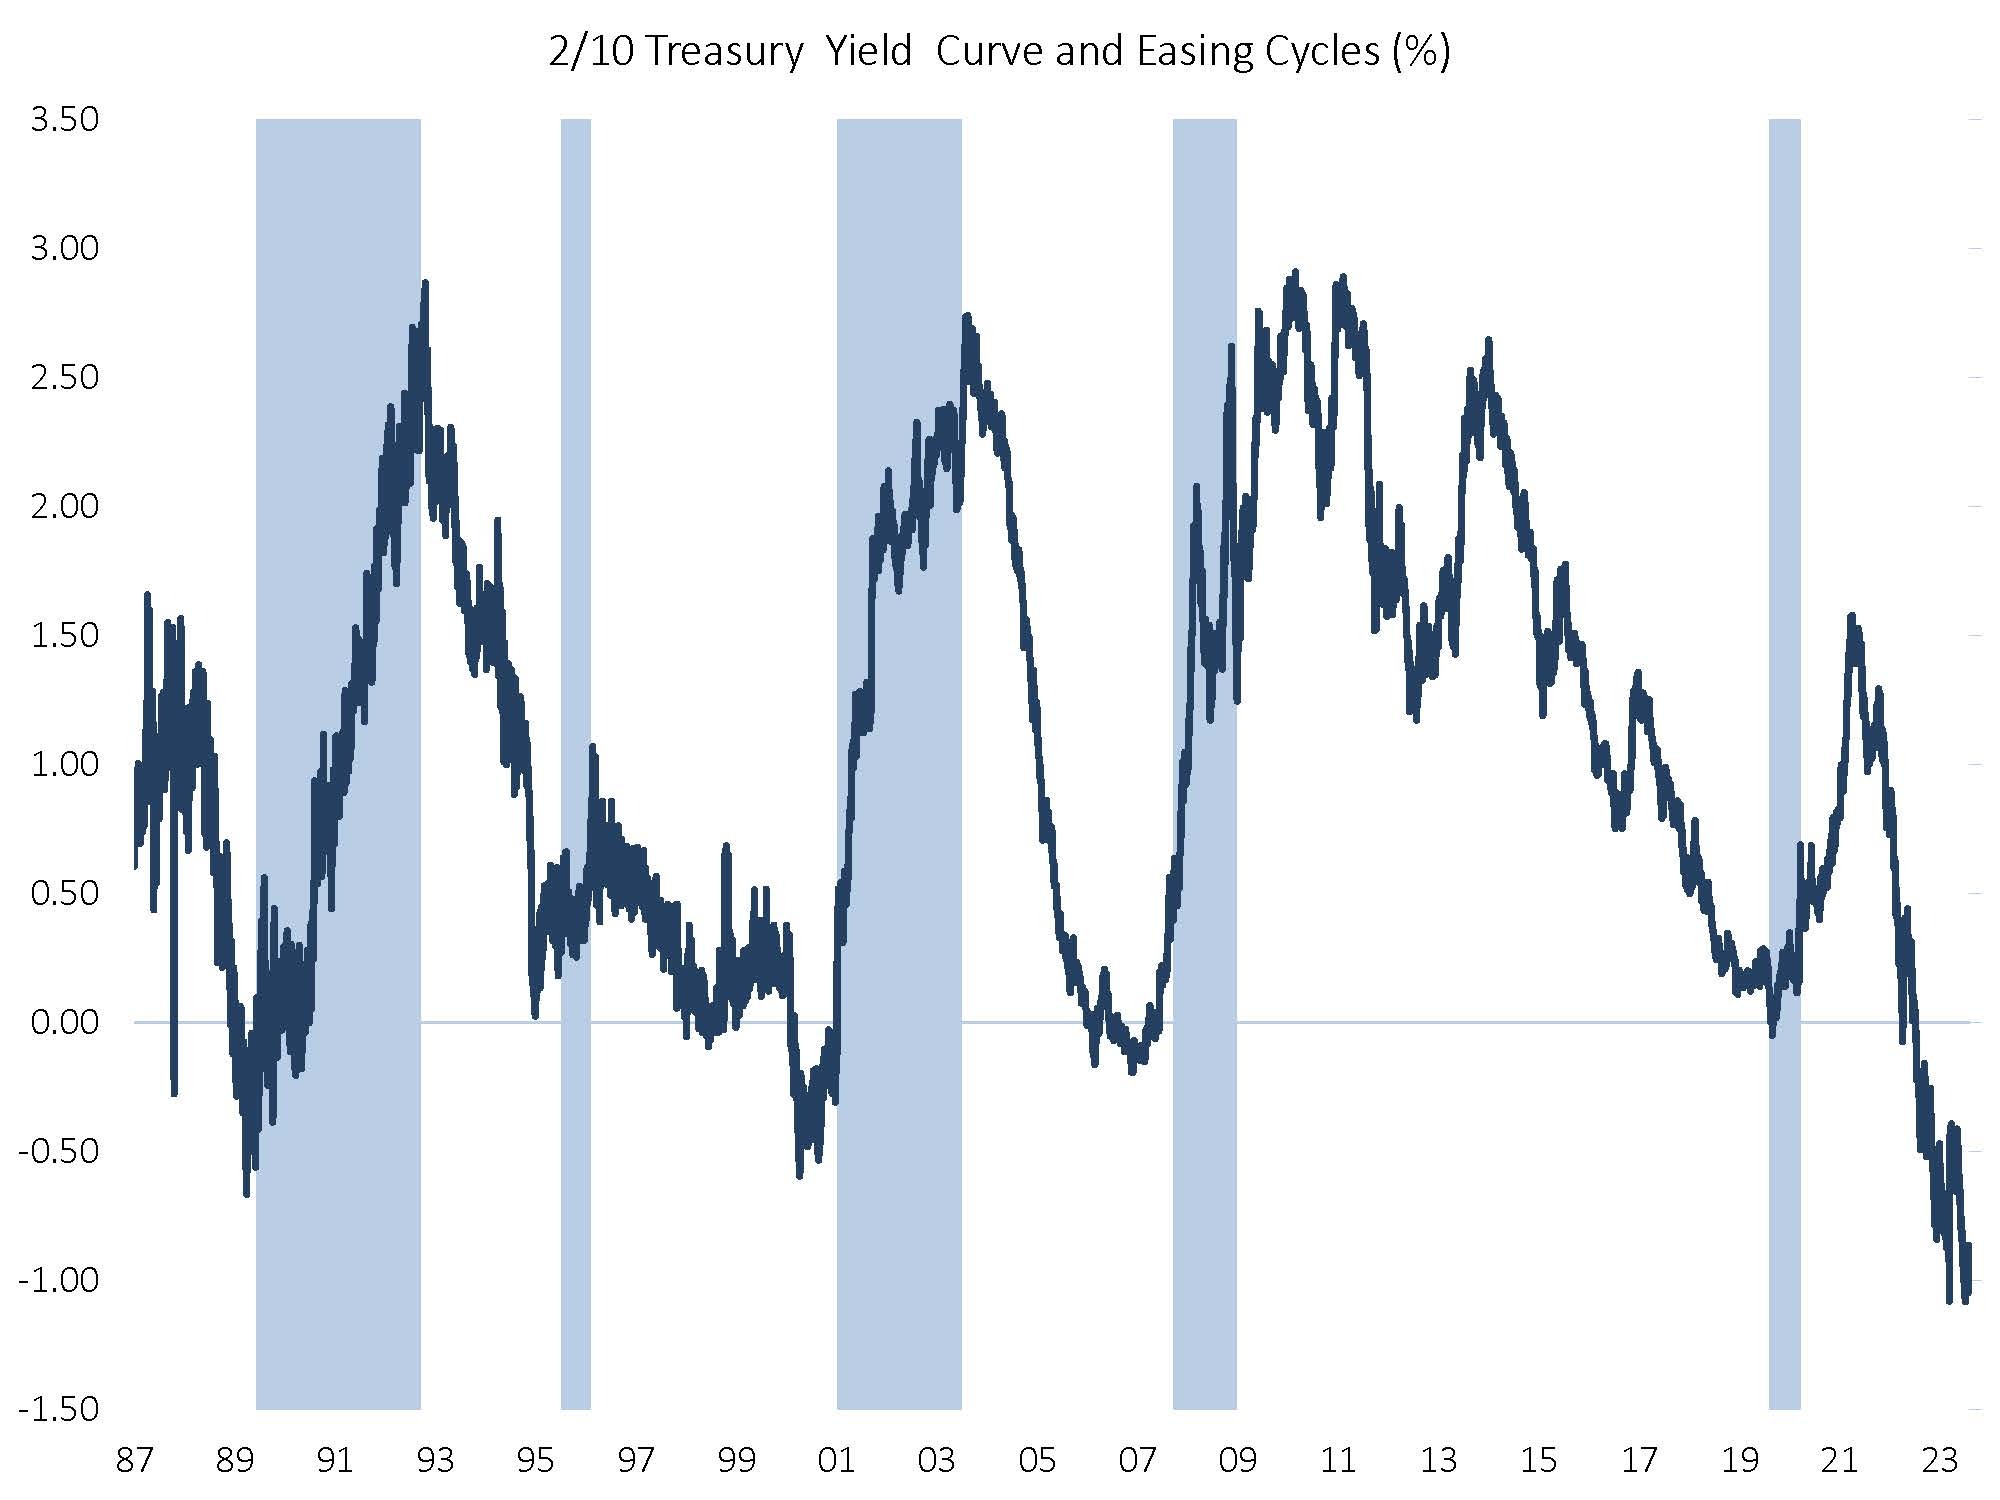
Both the Fed cycle and curve regimes will be shifting over the coming quarters as the Fed transitions from hiking to “on hold” to easing. Curve patterns are consistent and typically move from inversion to above-average steepness. The following chart shows the evolution of the yield curve since the late 1980s. In the most recent cycle, the yield curve has been on a flattening trend since the pandemic, but that’s going to change over the next year, and it will take some skill to navigate the shift to a steepening yield curve.
Curve and Duration Effects Will Be Meaningful
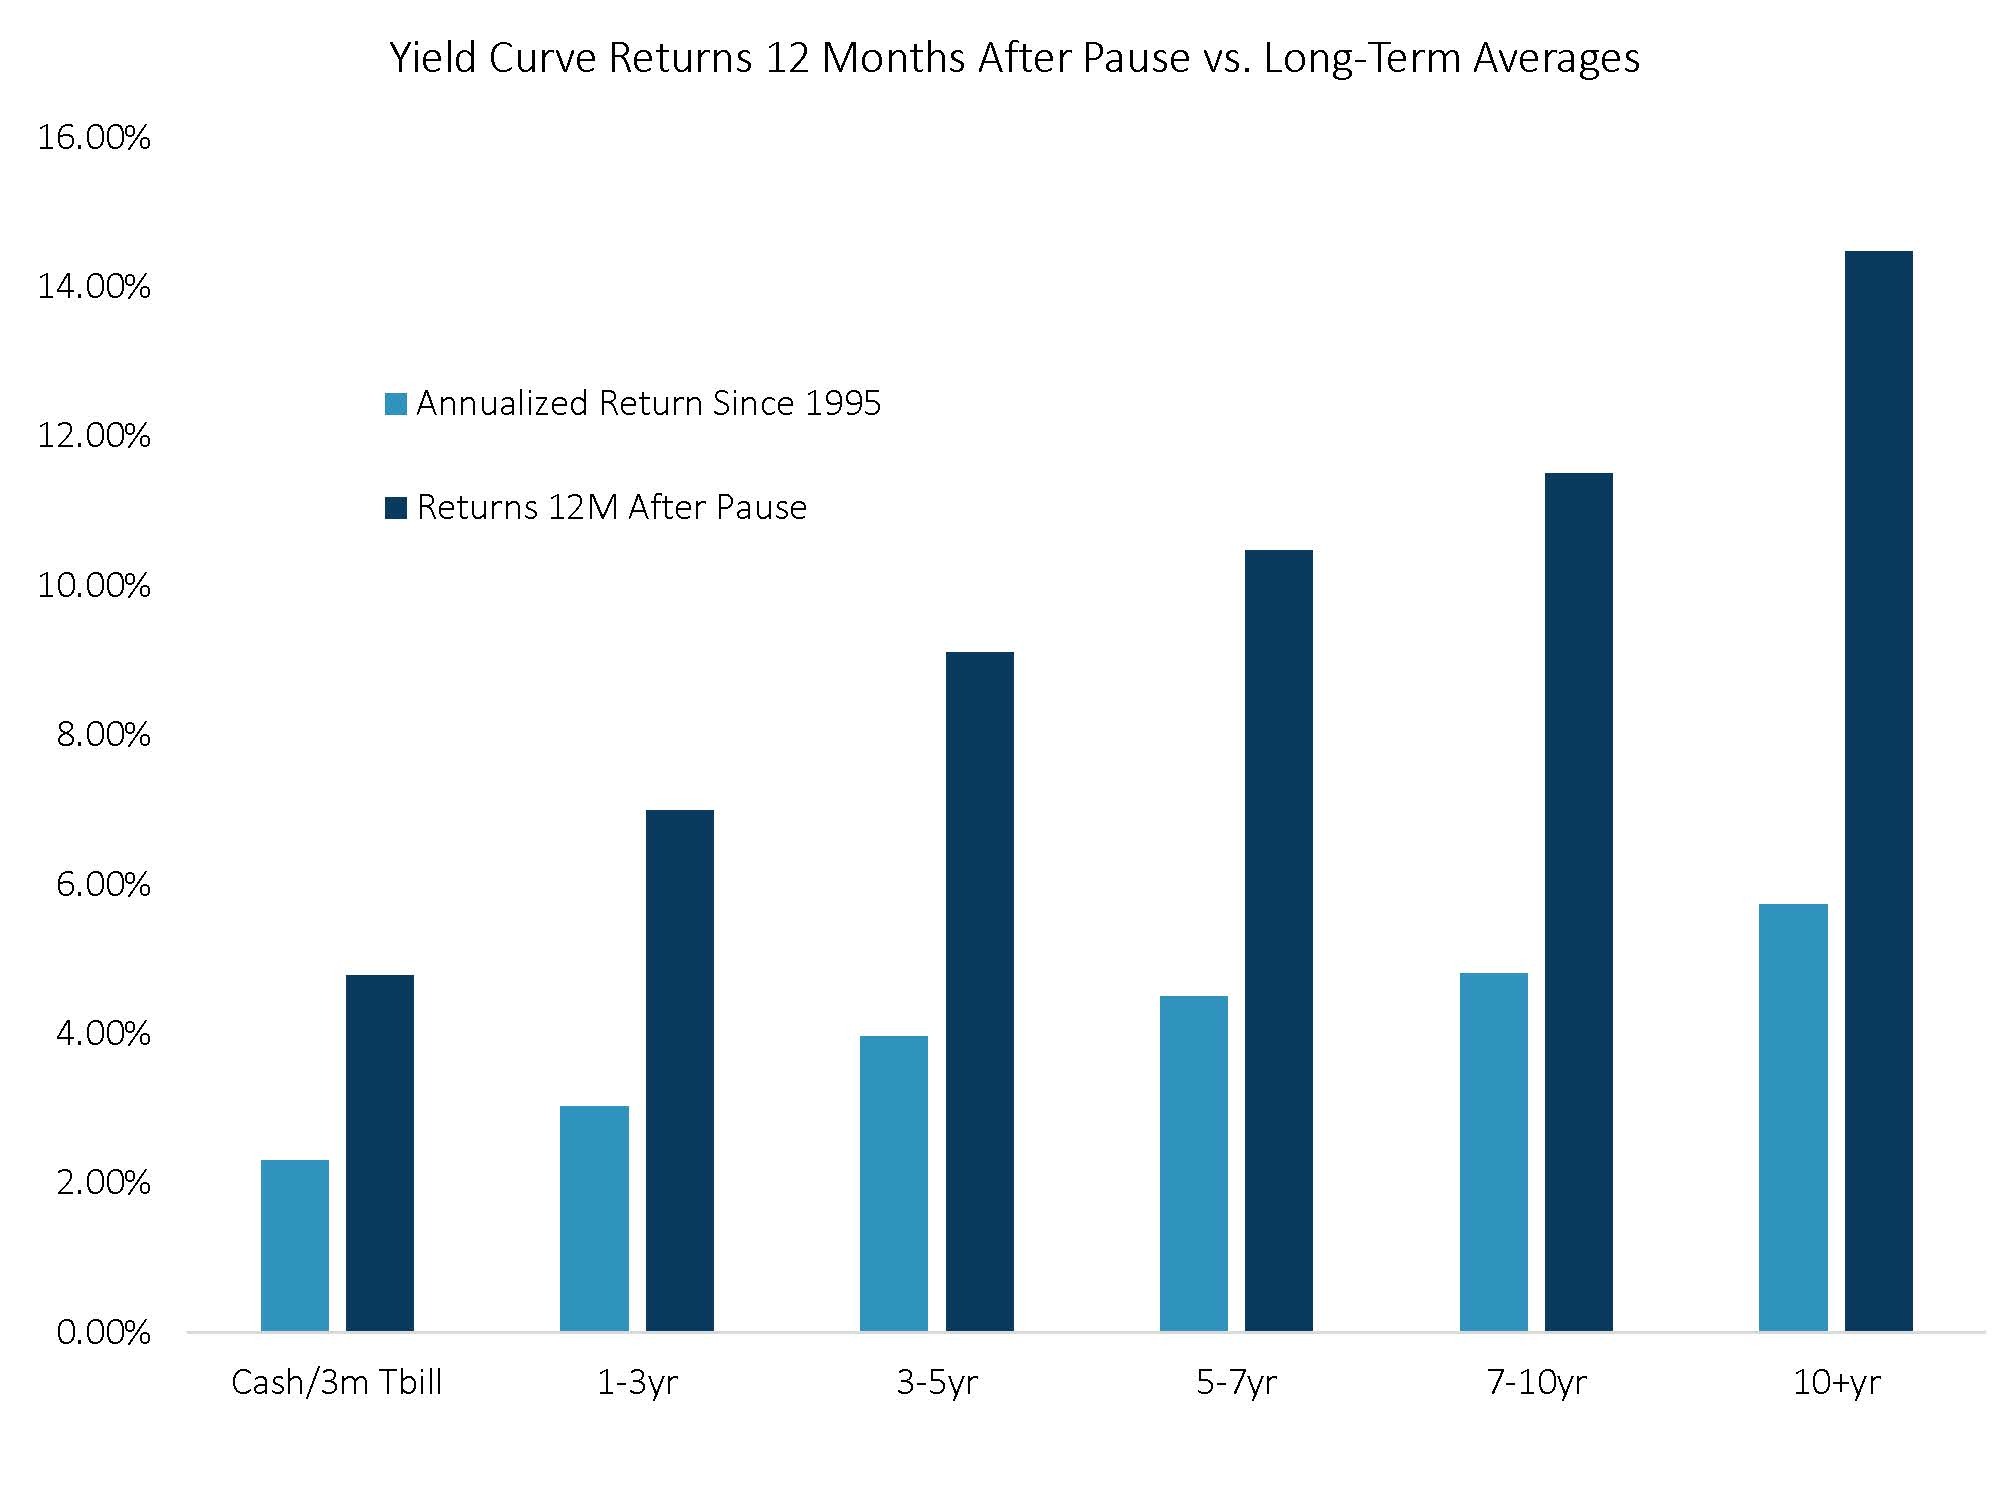
As the yield curve shifts from an inversion to re-steepening, as is typical at the end of a Fed cycle, it historically leads to large return differences. Active managers allocate across different curve segments and take outlook and valuations into account when navigating the yield curve transition.
Passive and Laddered Allocations May Miss Valuation Opportunities
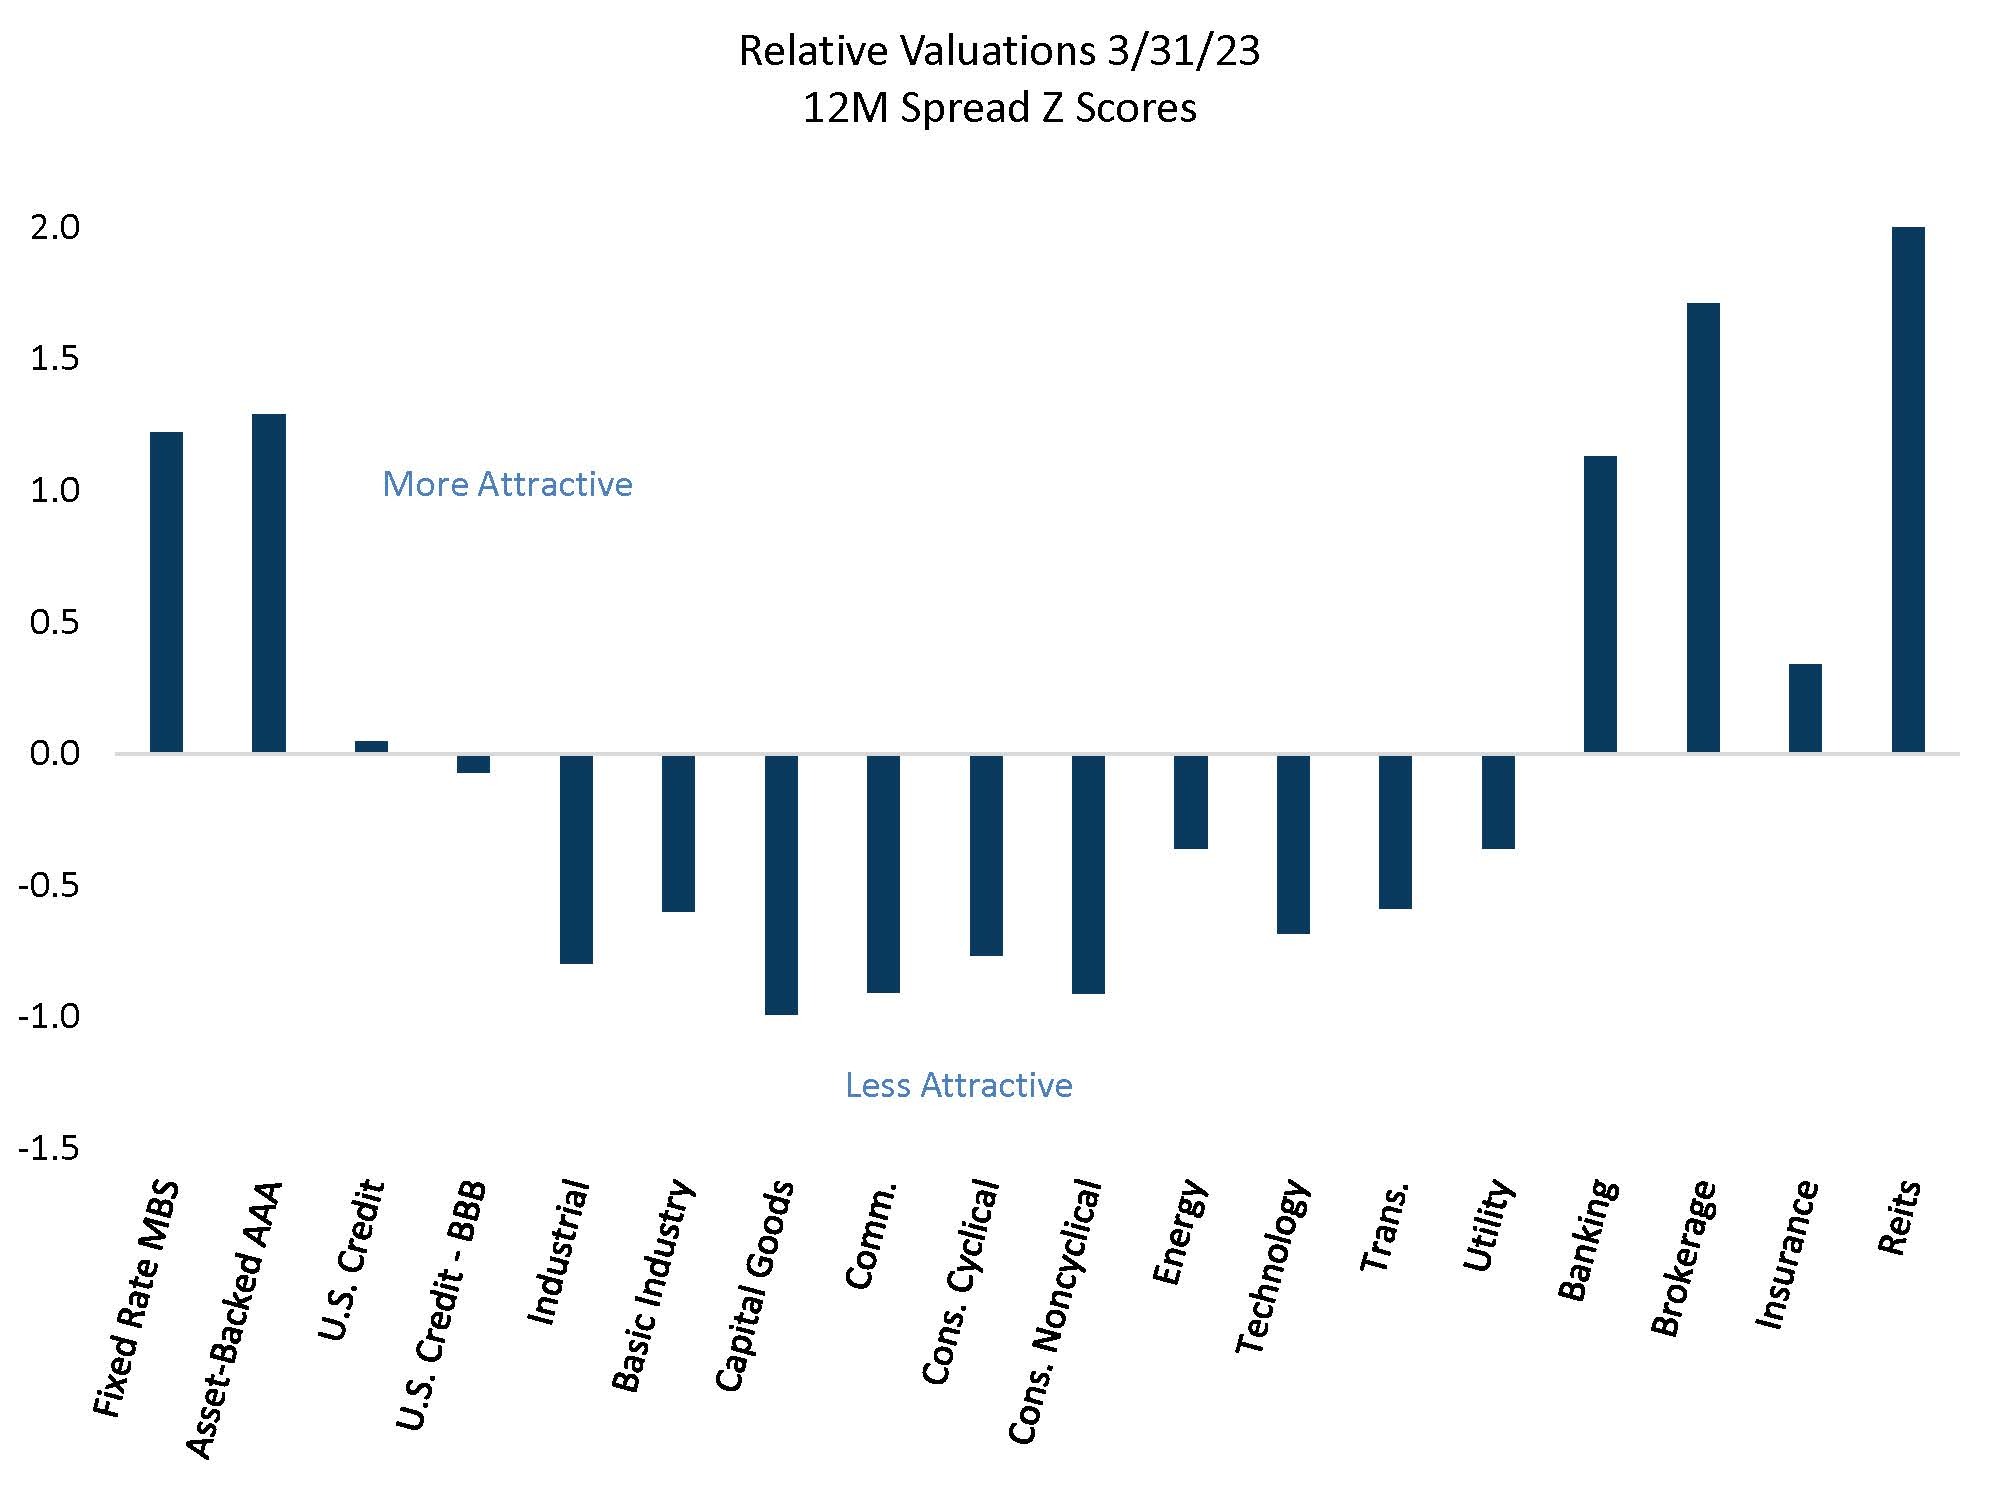
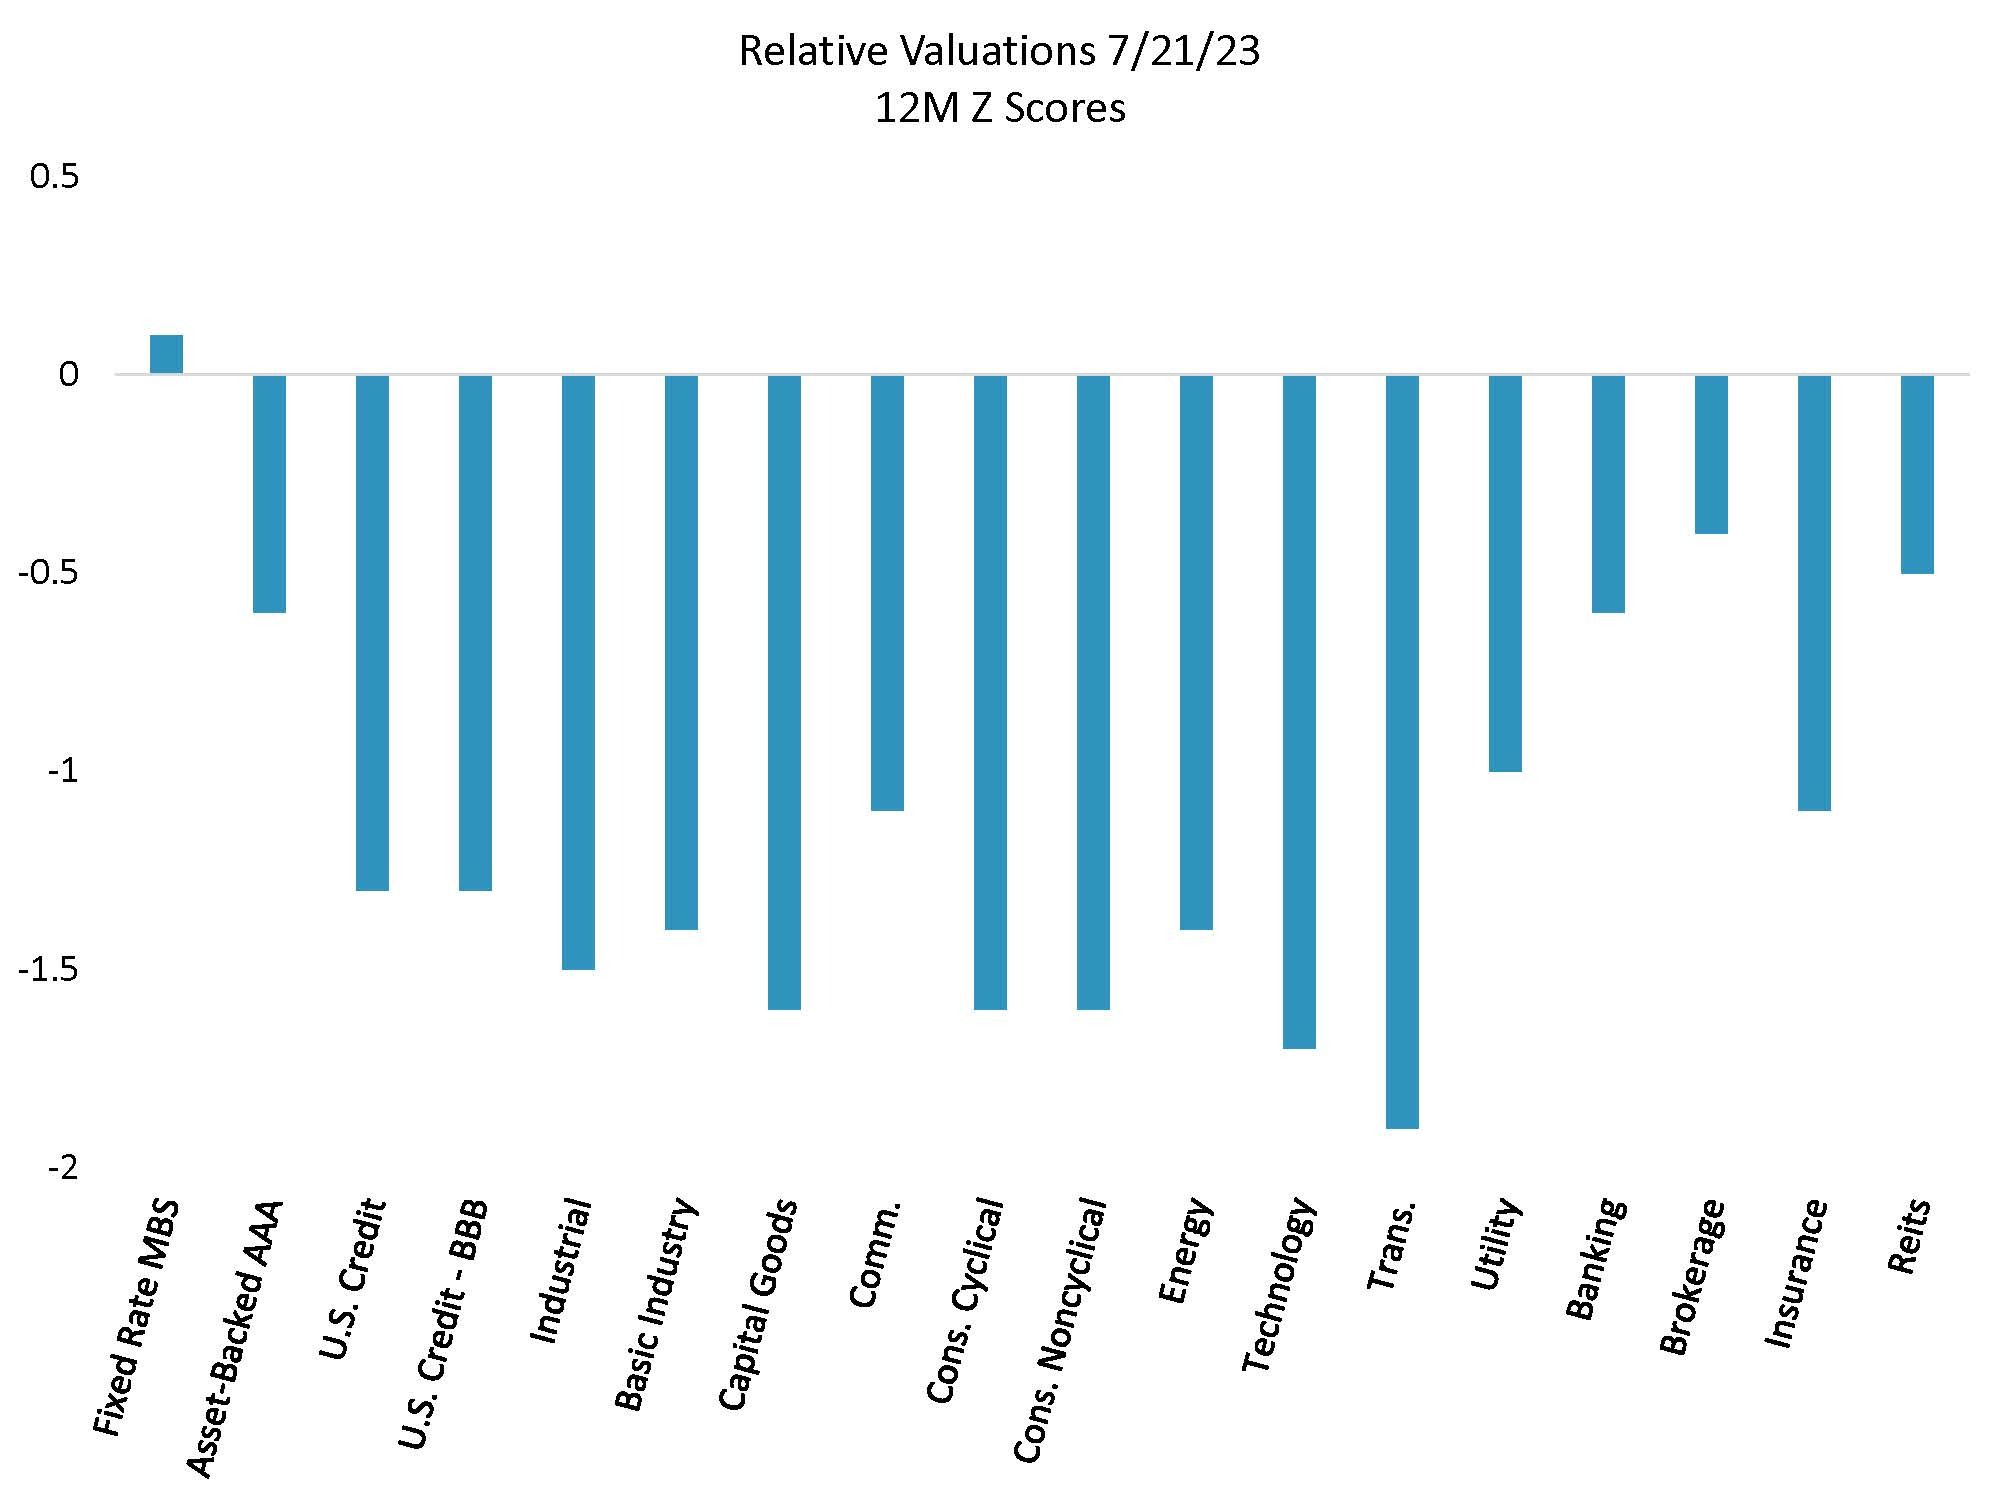
Outside curve and duration, sector and security selection can provide excess return and risk control opportunities. In just the last three months, we have seen large relative value shifts in mortgage-backed securities, financials, and in investment grade credit overall. The first chart shows that there were a lot of opportunities at the end of the first quarter, and the second chart illustrates that many sectors valuations’ have become rich. The spread indicates how wide or tight the sectors are versus their fair value, or long-term averages. If the spread is below zero, then spreads are tighter, or less attractive; if spreads are above zero, or wider, then they are more attractive. As spreads have tightened over the last quarter, it has made security selection very important. Security selection is not something that would typically be considered in a laddered portfolio, and active managers are able to take advantage of the relative value in sectors when considering a portfolio’s holdings.
Tight Spreads Now at the Index Level Means Security Selection is an Alpha Driver
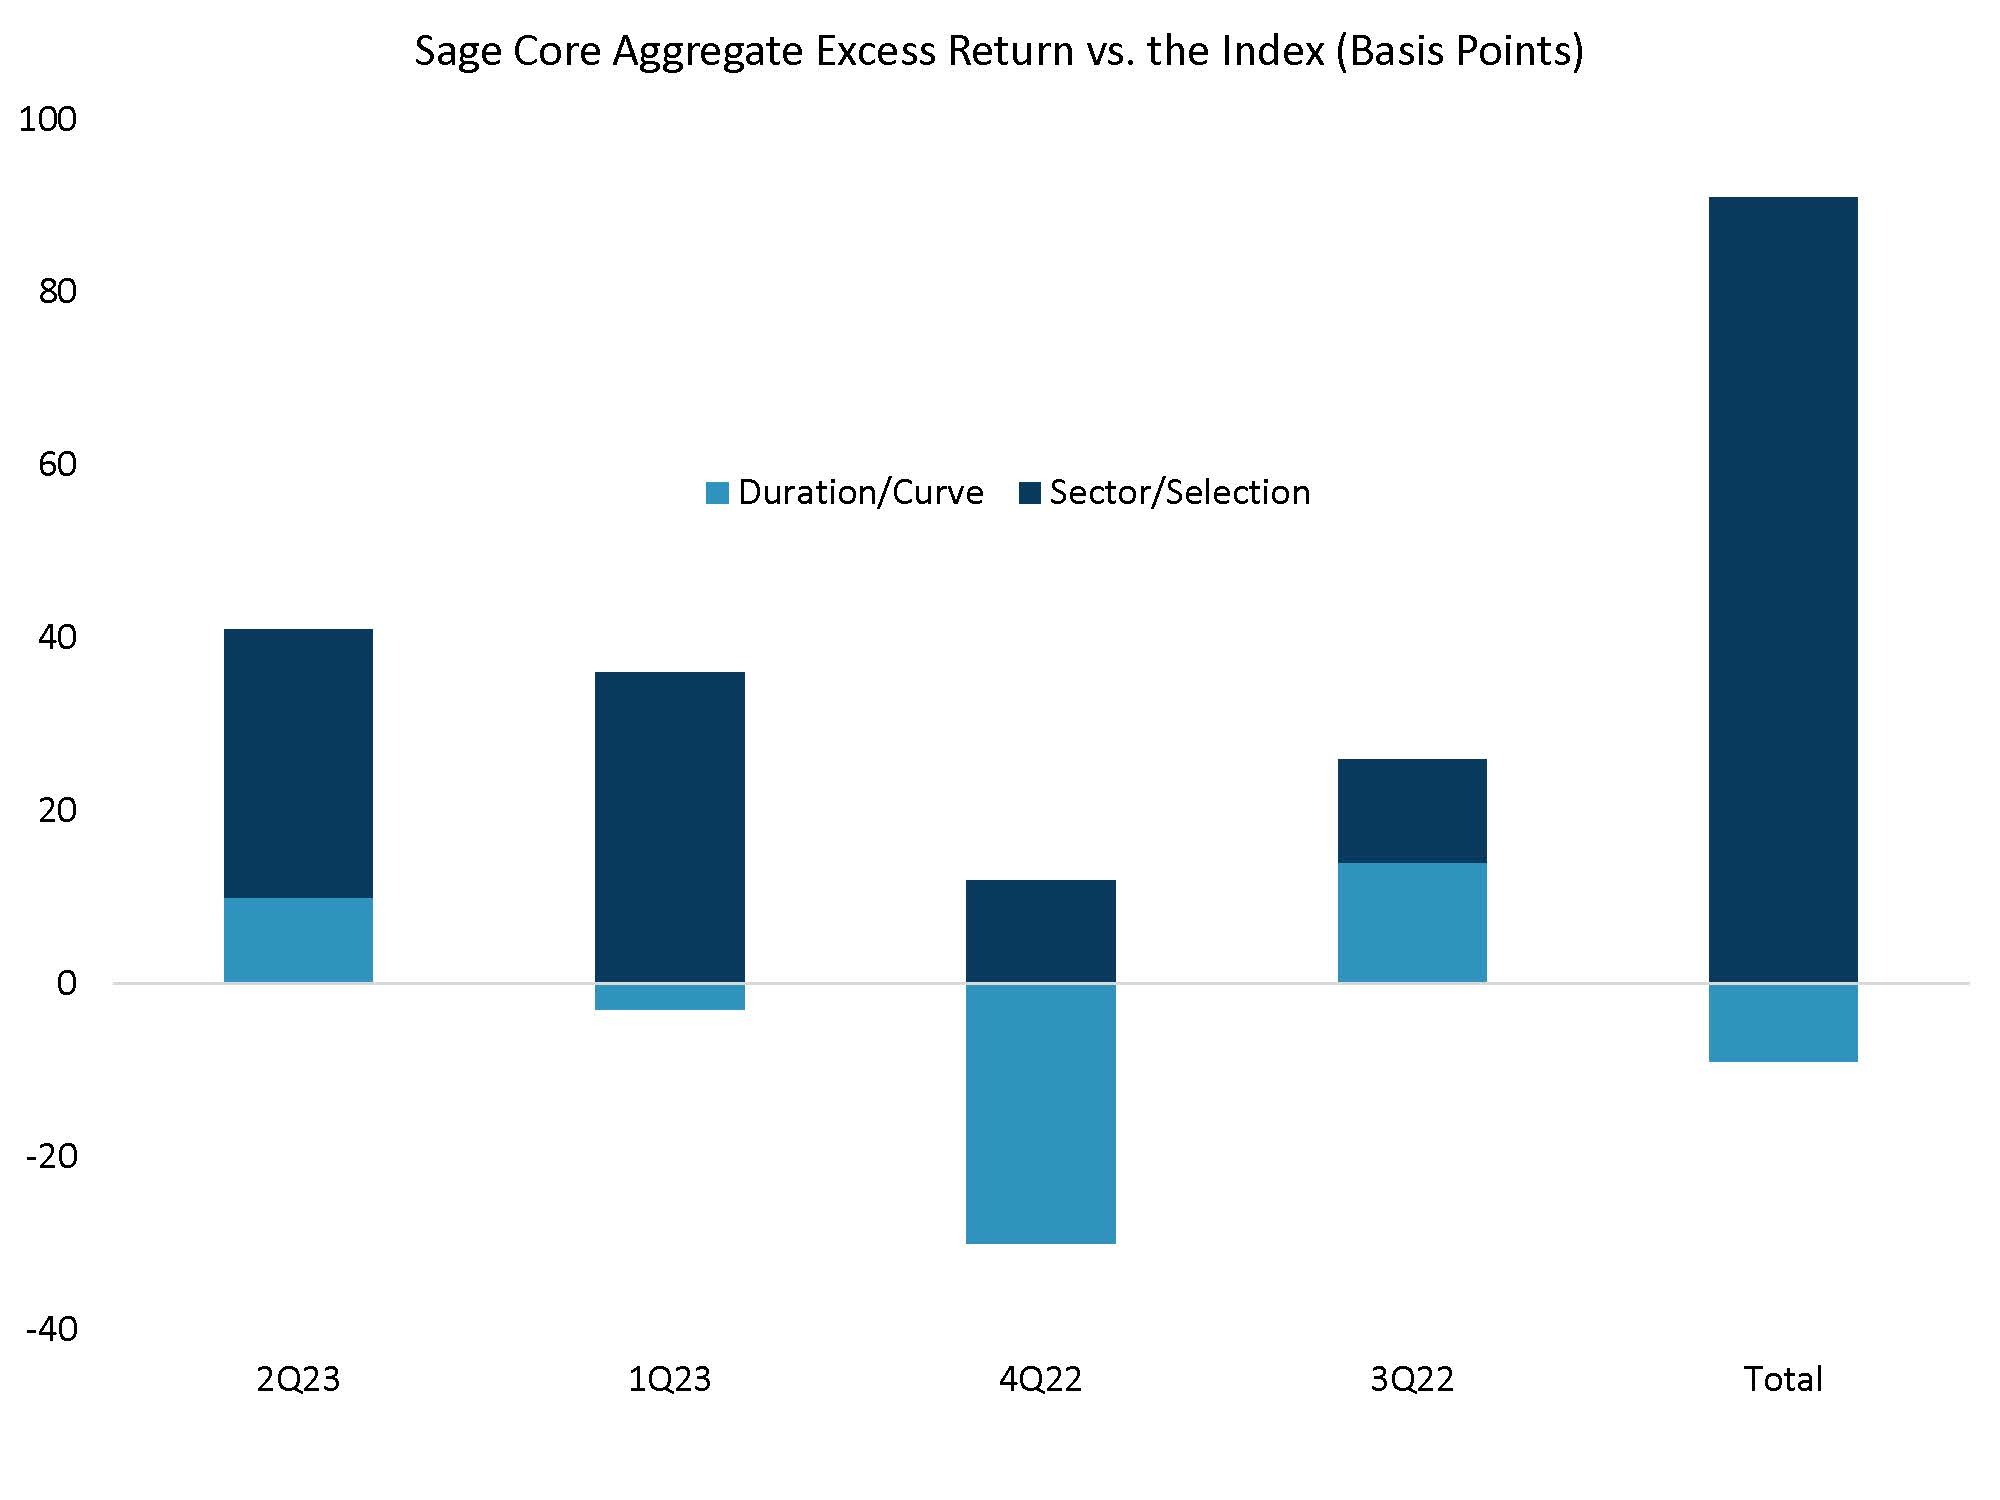
Active managers have multiple levers they can pull to generate alpha, or excess return, versus a portfolio’s benchmark. These include sector, security, and duration selection. Tight spreads means active sector and security selection have been a key alpha driver. This will continue to be the case in the near-term, but over the medium-term curve and duration will be a larger driver of return.
Source on all charts is Sage, Bloomberg.
Disclosures: This is for informational purposes only and is not intended as investment advice or an offer or solicitation with respect to the purchase or sale of any security, strategy or investment product. Although the statements of fact, information, charts, analysis and data in this report have been obtained from, and are based upon, sources Sage believes to be reliable, we do not guarantee their accuracy, and the underlying information, data, figures and publicly available information has not been verified or audited for accuracy or completeness by Sage. Additionally, we do not represent that the information, data, analysis and charts are accurate or complete, and as such should not be relied upon as such. All results included in this report constitute Sage’s opinions as of the date of this report and are subject to change without notice due to various factors, such as market conditions. Investors should make their own decisions on investment strategies based on their specific investment objectives and financial circumstances. All investments contain risk and may lose value. Past performance is not a guarantee of future results.
Sage Advisory Services, Ltd. Co. is a registered investment adviser that provides investment management services for a variety of institutions and high net worth individuals. For additional information on Sage and its investment management services, please view our website at www.sageadvisory.com, or refer to our Form ADV, which is available upon request by calling 512.327.5530.
For more news, information, and analysis, visit the ETF Strategist Channel.
