
By Corey Hoffstein, Newfound Research
In this week’s research note, we will explore a simple idea for how advisors and investors can “roll their own” long/short portfolio even if they do not have the ability to short individual securities.
The idea boils down to two simple concepts:
- Active portfolios are long/short portfolios all the way down.
- Capital efficiency.
The first concept can be quickly summarized as recognizing that a long-only, active portfolio can be thought of as the sum of two components: (1) a market-cap weighted index and (2) the over- and underweight decisions the active manager makes. The over- and underweight decisions form a dollar-neutral long/short portfolio and the notional size of the bets is equal to the active manager’s active share. When we overlay the long/short portfolio on top of the market-cap weighted index, we are given the long-only portfolio.
We can, therefore, take this idea in reverse: shorting out the market-cap weighted index from a long-only active strategy leaves us with the long/short portfolio. This idea allows us to take any actively managed portfolio – whether it is a basket of securities we pick or an actively managed fund – and turn it into a long/short portfolio.
There are a number of ways in which this might be achieved. For example, an investor could short an S&P 500 ETF or could short futures contracts. Unfortunately, many advisors and individuals do not have this opportunity.
Another option is to hold a long position in an inverse ETF such as the ProShares Short S&P 500 ETF (“SH”). The downside here is that precious capital is now tied up in a position that effectively returns Treasury Bills minus the S&P 500. We could try to use a levered short ETF, such as the ProShares UltraShort Short S&P 500 (“SDS”). Only half the necessary capital would be tied up with this trade, but we’d be introducing the potential for significant tracking error due to compounding effects. And that’s all to speak nothing of the cost.
For now, we are going to assume that an investor can simply short S&P 500 futures contracts and we’ll return to how an advisor or investor might go about implementing this idea in a more constrained setting.
As an example of constructing a long/short portfolio, we will use the idea of a momentum / low-volatility barbell which has been proposed by Lawrence Hamtil (and who has written about the idea a number of times). We will use the iShares Edge MSCI USA Momentum Factor ETF (“MTUM”) and the iShares Edge USA Min Vol Factor ETF (“USMV”) for our long factor positions. Prior to ETF launch, we will use index returns.
We will construct our portfolio as a simple 50-50 barbell, holding 47.5% of the portfolio in each ETF and keeping 5% aside as collateral for a 95% short position in S&P 500 futures.
The results are rather strong, both prior to ETF launch and after. Over the full period, our long/short portfolio returns 3.6% annualized with a volatility of just 5.4% and a maximum drawdown of 11.5%.
Now we should acknowledge here that constructing our portfolio in such a manner means that the notional size of our long/short is constrained by the active share of the ETFs themselves. For example, MTUM has an active share of 68.1% and USMV has an active share of 57.2%, giving our barbell an active share of 62.6%. This implies that when we short out our exposure to S&P 500 futures, the long/short portfolio we are left with is really only using 62.6% of capital.
Though this speaks nothing to the volatility of those active bets, investors should be aware that a methodology like this, when used on a low active share strategy will leave very little residual exposure.
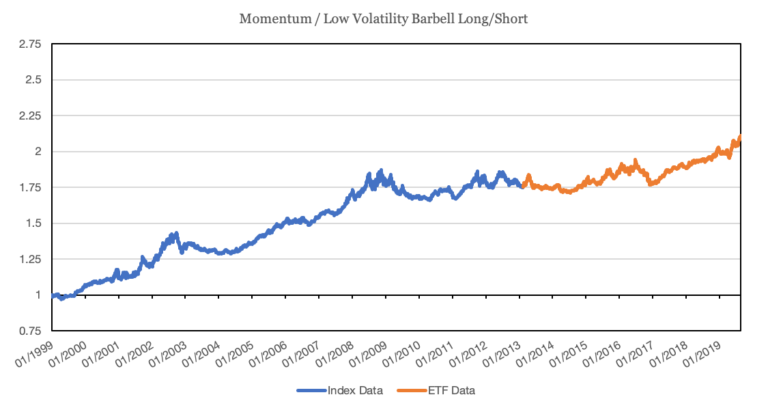
Source: CSI Data; MSCI; Stevens Futures; Calculations by Newfound Research. Results assume the reinvestment of all distributions. Results are gross of all fees, including, but not limited to, manager fees, transaction costs, and taxes. Past performance is not an indicator of future results.
Unless they are explicitly identified as market neutral, most long/short portfolios retain some equity market beta to benefit from the positive expected long-term equity risk premium. Therefore, it may make more sense to actually construct this portfolio using a target beta approach.
For example, we might calculate the beta of our 50/50 momentum/low-volatility barbell portfolio to the S&P 500 and then increase or decrease our exposure to our short futures position accordingly. If our barbell has a beta of 1.0 and we only want a beta of 0.5, we could hold 95% of our portfolio in the barbell, 5% in cash, and short 45% S&P 500 futures exposure to hit our target beta.
Below we plot the equity curves for portfolios targeting a beta of 0 through 0.5. We estimate beta using the historical realized covariance matrix and use an ensemble approach (varying the lookback window of our covariance matrix calculation) to generate weights.
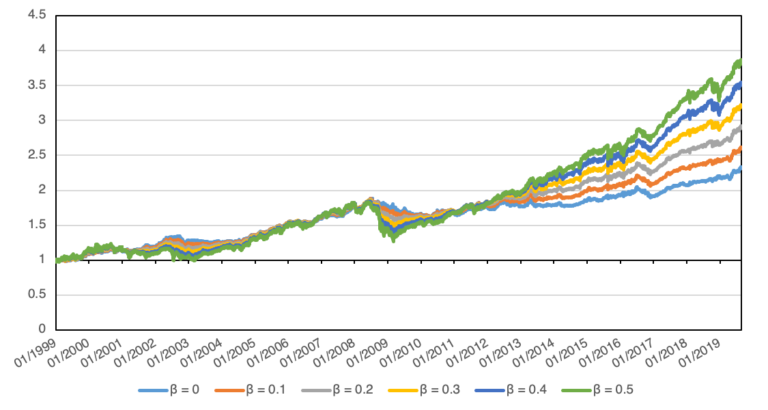
Source: CSI Data; MSCI; Stevens Futures; Calculations by Newfound Research. Results assume the reinvestment of all distributions. Results are gross of all fees, including, but not limited to, manager fees, transaction costs, and taxes. Past performance is not an indicator of future results.
