
By Michael Paciotti, CFA
“On the eve of recessions in 1990, 2001, and 2007, many Wall Street economists proclaimed the U.S. was on the cusp of achieving a soft landing, in which interest-rate increases corralled inflation without causing a recession,” Nick Timiraos, Chief Economics Correspondent, The Wall Street Journal.
Glass Half Full or Half Empty?
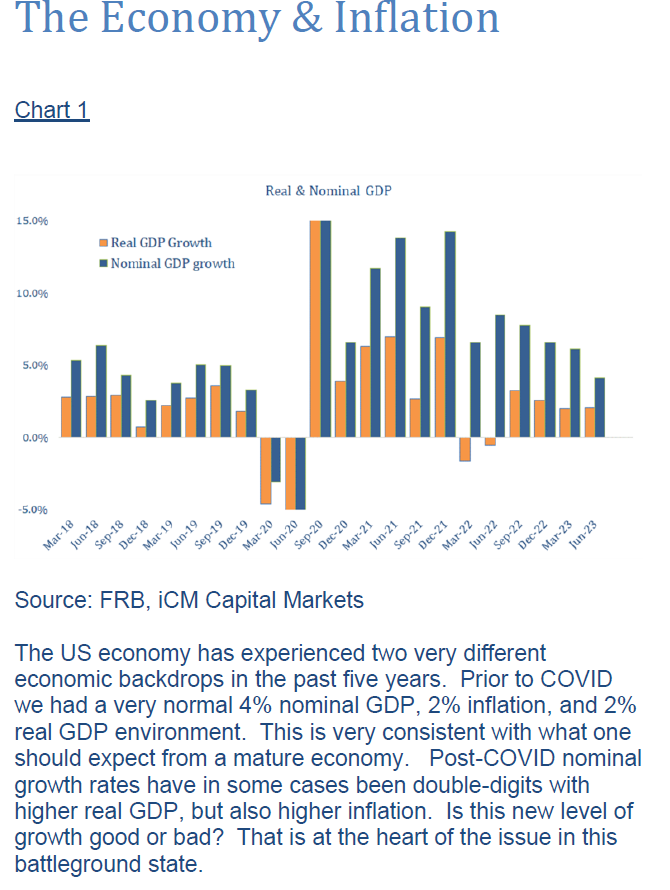
The overarching theme, for the balance of the past three years, has been the tug of war between economic growth and inflation. In Chart 1, I’m showing nominal and real GDP, or said differently, total economic output and inflation-adjusted economic output, with inflation representing the difference between the two.
Now, what I want to impress upon you is the clear difference in the level of economic output from the pre-COVID to the post-COVID environment. As has been the case for more than fifty years, we went from a mature economy generating 4-5% nominal GDP, 2% inflation, and roughly 2% real GDP to the post-COVID economic climate where nominal growth rates have been double digits, only recently declining to anything closely resembling what is sustainable. While some of this strong nominal growth resulted in an increase in real GDP, much of it ended up as inflation. So, battleground state number #1…. the overall economy. Is this strength good or bad? The glass half full view is that with economic growth this strong, it’s hard to envision a recession anytime soon. By contrast, the glass half empty crowd will point to the trend lower of each successive GDP print and even further by posing the question…how does inflation come in-line with 2% expectations if the economy remains this strong? Succinctly stated, and at the heart of this debate, is the following question: is the current strength sustainable and, if it is, is it a sign of prosperity or the cause of inflation? Even within the Fed’s own ranks we can see divergence. The Atlanta Fed is expecting 3q Real GDP to be a rather robust 4.9%, while the NY Fed sees 2.25% and the St. Louis Fed expects -0.25%. While some level of divergence is common, the Atlanta Fed is expecting a growth rate where inflation would remain higher than desired and meaningful further tightening by the Fed would probably be justified. By contrast, via the St. Louis Fed’s estimates, the US economy may already be in a recession. Nonetheless, I think it’s clear how conflicted, yet well supported, the argument’s pros and cons are pertaining to this issue.
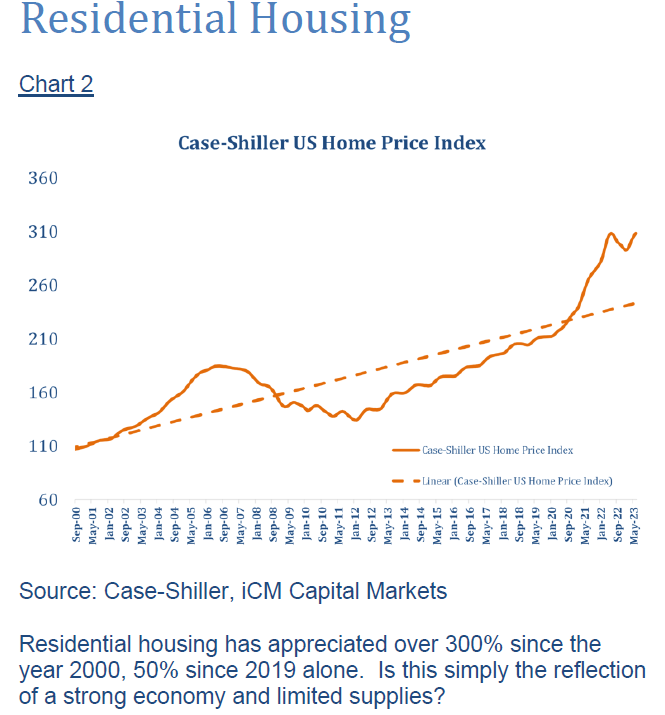
Battleground state #2, is a very popular topic these days and probably no less hotly debated, residential housing. In Chart 2, we are showing the Case-Shiller home price index, a popular measure of the ups and downs of the residential housing market. Now, it’s important to note that this does not represent the value of the average home. Rather, this is an index with a base value of 100 in the year 2000 and is essentially the cumulative gain in housing prices since 2000. For perspective, the median price of a home today is about $450k vs $150k in 2000 or roughly in-line with the 300% cumulative gain we see here. So, let’s draw the lines. The glass half full…with the economy so strong combined with low inventory levels, housing prices are simply reflective of the supply shortage and overall economic strength and prosperity. The glass half empty…with higher rates as well as elevated home prices, housing affordability is at its worst levels in 40 years. Surely something is amiss, and this is clearly an unsustainable trend. Which is correct? Let’s take this a step further.
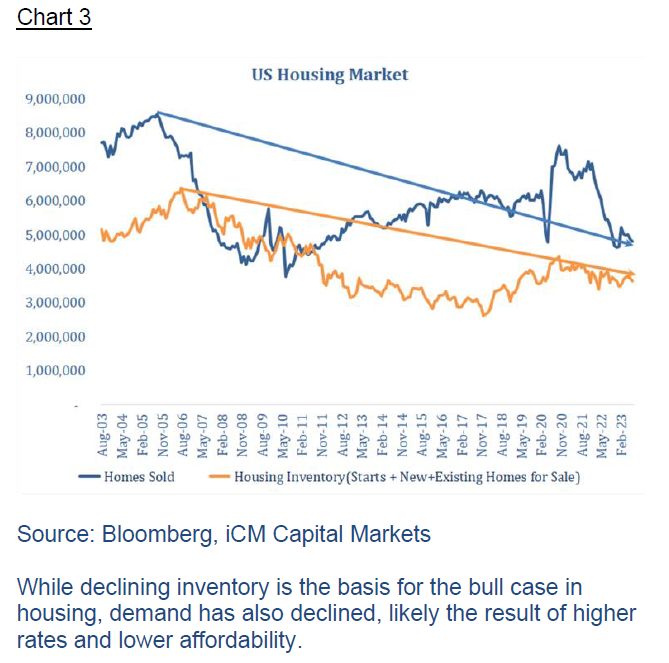
Chart 3 illustrates homes sold vs. inventory, or basically supply vs. demand. The point here is the trend. Clearly, we can see the decline in available inventory, the orange line. That of course is the explanation behind the strong housing market. But, the devil, as they say, is somewhere in the details because demand is also falling. In fact, existing home sales have dropped by nearly 30%. From 2020 through 2021, the average existing homes sold per month was roughly 6.2mm units. That has declined to about $4mm units today. Why? For that answer, we need to look no further than the path of interest rates. As a result of that path, over 90% of mortgages financed1 have a rate below 5%, 70% below are 4% and 26% are below 3%. Those homeowners face trading a low-rate mortgage for a 7.5% mortgage rate along with a more expensive home. As we saw in Chart 2, property values have appreciated 300% in the last 20 years and 50% over the last 5 years. These homeowners are technically “trapped in their homes”, to borrow a recent popular reference. While we can continue to debate if this is currently a plus or a minus, what we are witnessing folks has some elements that can be best described as concerning. In fact, demand has eroded to levels consistent with the collapse in housing in 2008, not exactly something I would call positive. Absent this supply crunch, I’m not sure there would be much debate.
1 Source: Morningstar
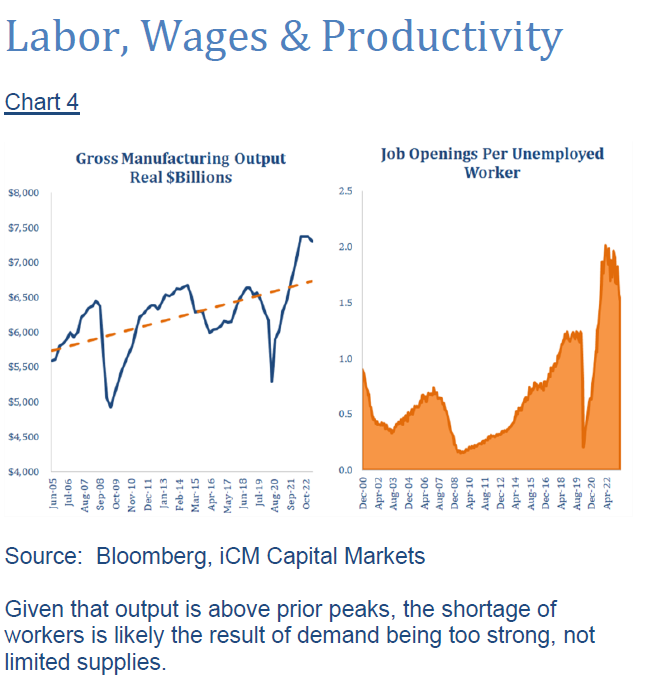
I’m going to call our final battleground state the collective of labor, wages and productivity. This slide shows two items. The first, jobs per unemployed worker, has declined a bit but remains extremely tight at roughly 1.5 jobs available per job seeker, in a labor pool that’s about 5 million workers larger than pre-COVID. This is clearly a very strong labor market with enough power in the hands of the worker to continue to demand higher future wages. This is shown on the panel to the right. The second panel shows real gross manufacturing output or the inflation adjusted total value of goods produced in our economy. Most recently this totaled about $7.3T of goods produced vs. $6.6T at the end of 2018, prior peak output. So, battleground lines here… How can the economy be weak when jobs and wage growth are so strong? Likewise, how can we require less workers when output is so strong? Very fair points. Alternatively, with output above pre-COVID production levels, limited supplies are no longer an issue. We are producing more than the 2018 peak. The strength in labor is the productive abilities. In this case I would argue that both are probably true. It is a sign of the current strength of our economy, but also begins to highlight the problem that exists with inflation. Demand is too strong.
Now there is another problem implied here and that’s wages. Strong wage growth created by high demand for labor can be inflationary. Essentially you have people making more money. Those dollars chase around the same fixed supply of goods and services and you get inflation. Similarly, wages are the primary input cost of business. So, what do businesses like to do when their costs go up? Raise prices. Inflation. There is an exception to that rule. Strong productivity gains allow for wage growth without causing inflation. Folks, the problem currently hasn’t necessarily been strong wages. It’s been strong wages combined with very weak productivity. In fact, 6 of the last 9 quarters have seen negative productivity growth rates or, said differently, businesses are paying more and producing less with those dollars. That is unfortunately a highly inflationary combination. But nonetheless there seems to be some debate around whether strong wages and labor markets are a good or a bad thing.
Conclusion
The macroeconomic environment of 2023 is clearly complex, with many crosscurrents and is ripe for debate. In the preceding paragraphs I’ve outlined three hotly contested areas of the economic backdrop, battleground states, as well as both bull and bear cases for each. I think it’s fair to say that each is far from conclusive.
We, like so many others, have our perspectives, which I have yet to fully articulate, at least in this article. Regardless of our viewpoint, which I will share momentarily, I must admit that it at best plays a secondary role in crafting our investment strategy. We buy undervalued assets and hold them for the duration of their cycle. Macroeconomics plays a role in evaluating these valuation opportunities on the margin. Said differently, we may view the same marginal valuation opportunity differently depending on whether the economic backdrop stands to be favorable or unfavorable. High Yield bonds are a perfect example. In an environment with few headwinds, we may view average spreads more favorably than we do in one where the Fed is pressing down hard on the economy. Best said, our macroeconomic view helps us to assess the margin of safety we require when we make investment decisions.
Our current view of the economy is based on one key point, inflation must arrive at 2% for a multitude of reasons and there are a whole host of consequences to capital markets if it is allowed to linger above 2% indefinitely. Since inflation is the result of the intersection of supply and demand, we must focus on what influences those variables. With output, above prior peaks (as shown in Chart 4), combined with a larger workforce, this is no longer a supply-related issue. We are simply out consuming our productive abilities. As a result, we would expect consumption to decline if we are to see inflation take that final step to 2%. Without it, rates would need to remain higher for longer. In either case, the eventual outcome is declining demand or, by definition, recession of some sort, hard or soft. The timing is the key. Getting inflation back to 2% quickly, will require a jolt. If it can be done gradually, that prolongs, but dulls the pain. The end result is the same, the economic cycle will reset, life will go on and at some point we will see the green shoots of new growth. Until then, we remain cautious in our approach. Thank you as always for your continued trust and confidence.
Market Insights is intended solely to report on various investment views held by Integrated Capital Management, an institutional research and asset management firm, is distributed for informational and educational purposes only and is not intended to constitute legal, tax, accounting or investment advice. Opinions, estimates, forecasts, and statements of financial market trends that are based on current market conditions constitute our judgment and are subject to change without notice. Integrated Capital Management does not have any obligation to provide revised opinions in the event of changed circumstances. We believe the information provided here is reliable but should not be assumed to be accurate or complete. References to specific securities, asset classes and financial markets are for illustrative purposes only and do not constitute a solicitation, offer or recommendation to purchase or sell a security. Past performance is no guarantee of future results. All investment strategies and investments involve risk of loss and nothing within this report should be construed as a guarantee of any specific outcome or profit. Investors should make their own investment decisions based on their specific investment objectives and financial circumstances and are encouraged to seek professional advice before making any decisions. Index performance does not reflect the deduction of any fees and expenses, and if deducted, performance would be reduced. Indexes are unmanaged and investors are not able to invest directly into any index. (MMXXIII)
For more news, information, and analysis, visit the ETF Strategist Channel.
