
SEPTEMBER AND OCTOBER MAY PROVIDE THE ‘WINDOW’ TO GET BACK ON TRACK
September and October have historically been some of the most difficult and volatile months for the stock market. For that reason, they can also be viewed as the months for ‘second chances.’ By ‘second chances’ we are referencing a potential opportunity window for investors to put money back to work (invested in the stock market), especially for those that have held excess cash throughout the strong rebound in stocks since March.
This year it appears that the window for second chances has arrived right on schedule. The US market has declined about 6% since its high on September 2nd and the decline in the technology-heavy NASDAQ has been even greater at about a 9% drawdown. We think this pullback creates a potential buying opportunity, but we do not know how long this window will remain open or how wide it will extend, particularly with the ongoing COVID-19 pandemic and the upcoming US presidential election. However, we believe that this window will eventually close as we get through this volatility ending this period of ‘second chances’. When it does, we think the secular bull market will continue to march on well beyond the election.
This week, we would like to offer our thoughts to anyone struggling with ideas for their excess cash. Additionally, we highlight our belief that a tailored financial plan can bring clarity to seemingly difficult investment decisions.
Investing excess cash: Clarify your goals
“If you don’t know where you’re going, any road will take you there.” – George Harrison
Until you know the destination, it’s very difficult to get started on your journey. Thus, before deciding how to invest excess cash, we would argue the first step should be to identify a goal for the money. This is where a financial advisor can help you clarify your objectives and understand your risk tolerance.
A common destination (goal) for investing is growth, which is typically associated with longer time horizons, higher potential returns, but also more volatility along the way. Another goal for investing might be to generate a certain amount of income, to fund retirement, or to maintain a certain lifestyle. These goals will help guide investment decisions, making the emotional choices about market levels and timing decisions less significant, in our view.
Should I wait to get started?
We understand that investors are hesitant to buy stocks after such a sharp recovery. While investors often feel uncomfortable buying stocks at all-time highs, by definition a bull market is constantly making them. We think a new bull market began from the lows in March and that the recent breakout to new highs is a confirming signal of that view. Our Chart of the Week reminds us that while bear markets occur, stocks have historically continued to ultimately rise despite political and economic shocks. Waiting for the next pullback and trying to time the right entry point is difficult and not a good strategy in our view, especially since the next significant pullback might come at a much higher price level than today.
Chart of the Week: Equity Markets Have Endured Throughout History
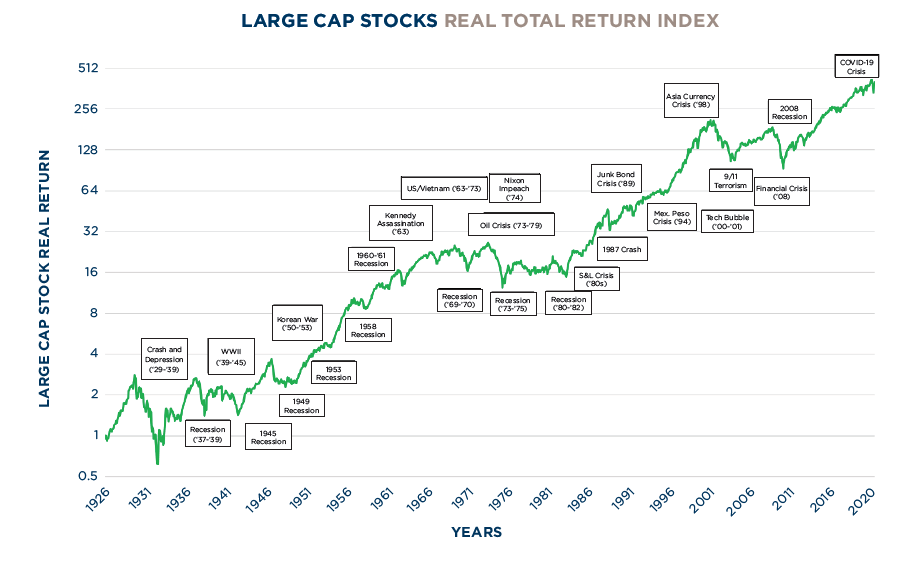
| Sources: IFR, Wikipedia, RiverFront Investment Group, and CRSP Data. Calculated based on data from CRSP 1925 US Indices Database ©2020 Center for Research in Security Prices (CRSP®), Booth School of Business, The University of Chicago. Data from Jan 1926 through May 2020. Real Return is the annual percentage return realized on an investment adjusted for inflation. CRSP (1-2) Cap-Based Portfolio definition may be found on page 44. Past performance is no guarantee of future results. It is not possible to invest directly in an index. Shown for illustrative purposes only and not indicative of RiverFront portfolio performance. Boxes are pointing towards approximate time frames. |
We think the chart also highlights the benefits of dollar cost averaging, rather than market timing. Reluctant investors might consider regularly feeding cash into the market to provide a chance to buy at lower levels should they occur. This process also lowers the emotional impact of picking a specific day or week to get started. We wrote a more detailed piece for reinvestment plans in our April 13th Weekly View: Reinvesting in a Rising Market is Like Merging into Traffic.
For investors focused on growth:
There is an old Chinese proverb that goes something like this:
“The best time to plant a tree was 20 years ago. The second-best time is now.”
With a longer investment horizon, the importance of market timing decreases significantly, in our view. From this perspective, we believe long-term investors should be more troubled by missing market upside, than avoiding some temporary downside. While we believe stocks offer more growth potential than bonds over time, that growth comes with greater levels of risk and volatility, such as what we have experienced in the last few days.
For investors focused on income:
With historically low interest rates, there is a cost to holding cash. Money market instruments and certificates of deposit (CDs) are currently paying about 1% or less. With inflation around 1% (as measure by the Consumer Price Index), cash on the sidelines is not keeping pace with prices. Thus, we believe investors should weigh the risks of losing purchasing power against the risk of losing principal. The longer your timeframe, the more losing purchasing power becomes the greater risk, in our view.
In the past, retirees could rely on the fixed income portion of their account to generate enough income to meet their lifestyle needs. Today, we argue that stocks need to play a part in generating cashflow, whether through their dividends or capital appreciation. While fixed income won’t provide as much current income as was enjoyed by previous generations, we still believe bonds still play a valuable role in lowering overall portfolio volatility and reducing the magnitude of drawdowns when stocks are falling. For example, at the March 23rd low, the S&P 500 declined more than 30% on the year while bonds, as measured by the Bloomberg Barclays US Aggregate, gained 1%.
In Conclusion:
We believe the recent volatility has opened a window of opportunity for investors to confirm their portfolio aligns with their goals. For those that have stockpiled cash, we think the next couple months will offer a “second chance” to start investing again.
Fortunately, with the help of a financial advisor, an investment strategy can be tailored to the unique goals of the individual while properly balancing the relevant risks and rewards. A well-structured financial plan should incorporate the potential for corrections and bear markets and give you the confidence to start making your cash more productive.
Important Disclosure Information
The comments above refer generally to financial markets and not RiverFront portfolios or any related performance. Opinions expressed are current as of the date shown and are subject to change. Past performance is not indicative of future results and diversification does not ensure a profit or protect against loss. All investments carry some level of risk, including loss of principal. An investment cannot be made directly in an index.
Chartered Financial Analyst is a professional designation given by the CFA Institute (formerly AIMR) that measures the competence and integrity of financial analysts. Candidates are required to pass three levels of exams covering areas such as accounting, economics, ethics, money management and security analysis. Four years of investment/financial career experience are required before one can become a CFA charterholder. Enrollees in the program must hold a bachelor’s degree.
Information or data shown or used in this material was received from sources believed to be reliable, but accuracy is not guaranteed.
This report does not provide recipients with information or advice that is sufficient on which to base an investment decision. This report does not take into account the specific investment objectives, financial situation or need of any particular client and may not be suitable for all types of investors. Recipients should consider the contents of this report as a single factor in making an investment decision. Additional fundamental and other analyses would be required to make an investment decision about any individual security identified in this report.
In a rising interest rate environment, the value of fixed-income securities generally declines.
Stocks represent partial ownership of a corporation. If the corporation does well, its value increases, and investors share in the appreciation. However, if it goes bankrupt, or performs poorly, investors can lose their entire initial investment (i.e., the stock price can go to zero). Bonds represent a loan made by an investor to a corporation or government. As such, the investor gets a guaranteed interest rate for a specific period of time and expects to get their original investment back at the end of that time period, along with the interest earned. Investment risk is repayment of the principal (amount invested). In the event of a bankruptcy or other corporate disruption, bonds are senior to stocks. Investors should be aware of these differences prior to investing.
Standard & Poor’s (S&P) 500 Index measures the performance of 500 large cap stocks, which together represent about 80% of the total US equities market.
Bloomberg Barclays US Aggregate Bond Index measures the performance of the US investment grade bond market. The index invests in a wide spectrum of public, investment-grade, taxable, fixed income securities in the United States – including government, corporate, and international dollar-denominated bonds, as well as mortgage-backed and asset-backed securities, all with maturities of more than one year.
NASDAQ Technology Dividend Index includes up to 100 Technology and Telecommunications companies that pay a regular or common dividend. Companies selected for the index must be classified as a Technology or Telecommunications companies and have a minimum market capitalization of $500 million.
The Consumer Price Index released by the US Bureau of Labor Statistics is a measure of price movements by the comparison between the retail prices of a representative shopping basket of goods and services. The purchase power of USD is dragged down by inflation.
RiverFront Investment Group, LLC (“RiverFront”), is a registered investment adviser with the Securities and Exchange Commission. Registration as an investment adviser does not imply any level of skill or expertise. Any discussion of specific securities is provided for informational purposes only and should not be deemed as investment advice or a recommendation to buy or sell any individual security mentioned. RiverFront is affiliated with Robert W. Baird & Co. Incorporated (“Baird”), member FINRA/SIPC, from its minority ownership interest in RiverFront. RiverFront is owned primarily by its employees through RiverFront Investment Holding Group, LLC, the holding company for RiverFront. Baird Financial Corporation (BFC) is a minority owner of RiverFront Investment Holding Group, LLC and therefore an indirect owner of RiverFront. BFC is the parent company of Robert W. Baird & Co. Incorporated, a registered broker/dealer and investment adviser.
To review other risks and more information about RiverFront, please visit the website at www.riverfrontig.com and the Form ADV, Part 2A. Copyright ©2020 RiverFront Investment Group. All Rights Reserved. ID 1324972
