
The steady rise in the 10-year T-note has started to raise concerns about the impact of higher yields. This week’s report will examine what impact the steady rise in yields may have on the economy and markets. Essentially, the issue at hand is if, how, or when the FOMC will act to intervene in the rise of yields. We suspect there are two factors that would sway policymakers. The first would be if the rise in yields had an adverse impact on housing. The second is if it would trigger a problem in the financial markets. Equity markets are one potential clue; the other would be credit markets. We will discuss housing and equity markets in this report, and cover credit spreads in the accompanying chartbook.
For starters, it makes sense to gauge the situation of current yields.
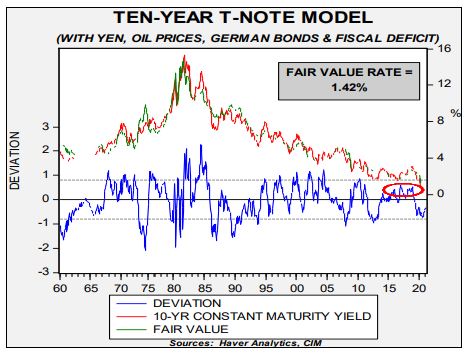
The two most important variables in the model are fed funds and the 15-year average of the yearly change in CPI. The latter acts as a proxy for inflation expectations. We add the yen’s exchange rate, oil prices, German Bund yields, and the fiscal deficit scaled to GDP. Although yields are rising, they remain below the fair value yield, which is currently at 1.42%. Note the red ellipse on the chart. At that level of overvaluation, yields would be 1.90% to 2.00%. In recent years, this level has been the peak yield. For now, yields remain below their fundamental value but a rise to 2.00% is not out of the question.
If yields continue to rise, what are the risks? For the real economy, the primary concern would be residential real estate. Mortgage yields are closely tied to the 10-year T-note spread and rising yields could make housing less affordable.
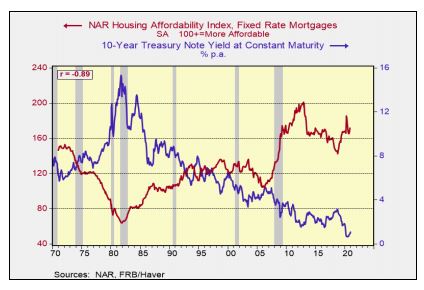
The housing affordability index consists of mortgage rates, home prices, and household income. The higher the reading of the index, the more affordable residential real estate is for the median buyer. A simple model of this relationship suggests that a 2.00% 10-year yield would reduce the affordability index to 162.1. That would be a rather modest decline and probably not one significant enough to warrant intervention by the FOMC.
Finally, there is a well-known relationship between P/Es and long-term interest rates.
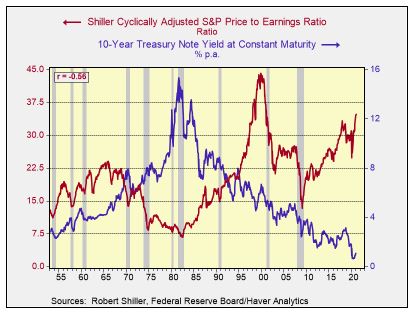
This chart shows the cyclically adjusted P/E (CAPE) and the 10-year yield. Although the CAPE is elevated, some of the lift is a function of lower yields. It is important to note that some of the rise in long-duration interest rates is a function of stronger economic growth. Better economic growth is affecting earnings. Our most recent iteration of our earnings model generates S&P 500 earnings this year of $153.72, up from our initial forecast of $147.84.1 Earnings per share is being adversely affected by a rising divisor, a function of new share issuance. Rising rates are triggering a decline in the fair value multiple to 25.4x (from 26.9x), yielding a fair value of 3905, which is modestly below the low end of our previously forecast range of 3918 to 4050. A rise to 2.00% on the 10-year would reduce the fair value P/E to 24.8x, ceteris paribus. Overall, though, we remain favorable toward equities simply due to the outstanding level of liquidity available to financial markets.
In closing, what form would Federal Reserve intervention take? The most aggressive action the FOMC could take would be yield curve control, where the central bank would set the rate for Treasuries and allow its balance sheet to expand and contract to accommodate the fixing of interest rates. There is, in our estimation, a good chance this will occur at some point. But the above analysis suggests that, barring a crisis, it would probably take a yield above 2.00% on the 10-year Treasury based on current conditions. Will we reach that level? Probably not in the near term. Therefore, we expect the FOMC to continue to talk about policy accommodation for the foreseeable future but avoid the topic of yield curve control until forced to act.
Past performance is no guarantee of future results. Information provided in this report is for educational and illustrative purposes only and should not be construed as individualized investment advice or a recommendation. The investment or strategy discussed may not be suitable for all investors. Investors must make their own decisions based on their specific investment objectives and financial circumstances. Opinions expressed are current as of the date shown and are subject to change.
This report was prepared by Confluence Investment Management LLC and reflects the current opinion of the authors. It is based upon sources and data believed to be accurate and reliable. Opinions and forward-looking statements expressed are subject to change. This is not a solicitation or an offer to buy or sell any security.
1 This earnings number is based on Standard and Poor’s calculation method, which is more conservative than the widely reported Thomson/Reuters earnings. In general, the former is usually about 7% less than the latter.
