
By Henry Ma, Julex Capital
Since the Great Recession bear market bottom in March 2009, the S&P 500 stock index is up a jaw-dropping 300%. In addition, the index is approximately 80% higher than its 2007 peak. Housing markets have also made a full recovery.
The Case/Shiller National Housing Price Index is about 10% higher than the peak reached in 2006. The extraordinary monetary stimulus by the Federal Reserve, including seven years of zero interest rates and three rounds of quantitative easing, have pushed all the asset prices to very high levels relative to their fundamentals. We are in danger of entering a “everything bubble”.
U.S. stocks are at all-time highs and the valuation has become very expensive. The widely-followed cyclically-adjusted price-earnings ratio (Shiller PE) reached 32.3, almost twice as much as the historical average of 16.9 (see Figure 1).
The current PE level is pretty much the same as that preceded by the market crash in 1929. Although it is still lower than the levels during the Dot Com bubble, the current high valuation has become a little extreme and it is not unreasonable to say we are in the bubbly territory.
Historically, the most severe market downturns started with extreme market valuations (see “3 Worst Bear Markets Started with High PE”). We should expect the next bear market will be very severe when it finally comes.
Figure 1: Cyclically-adjusted Price-Earnings Ratio (Shiller PE Ratio)
![]()
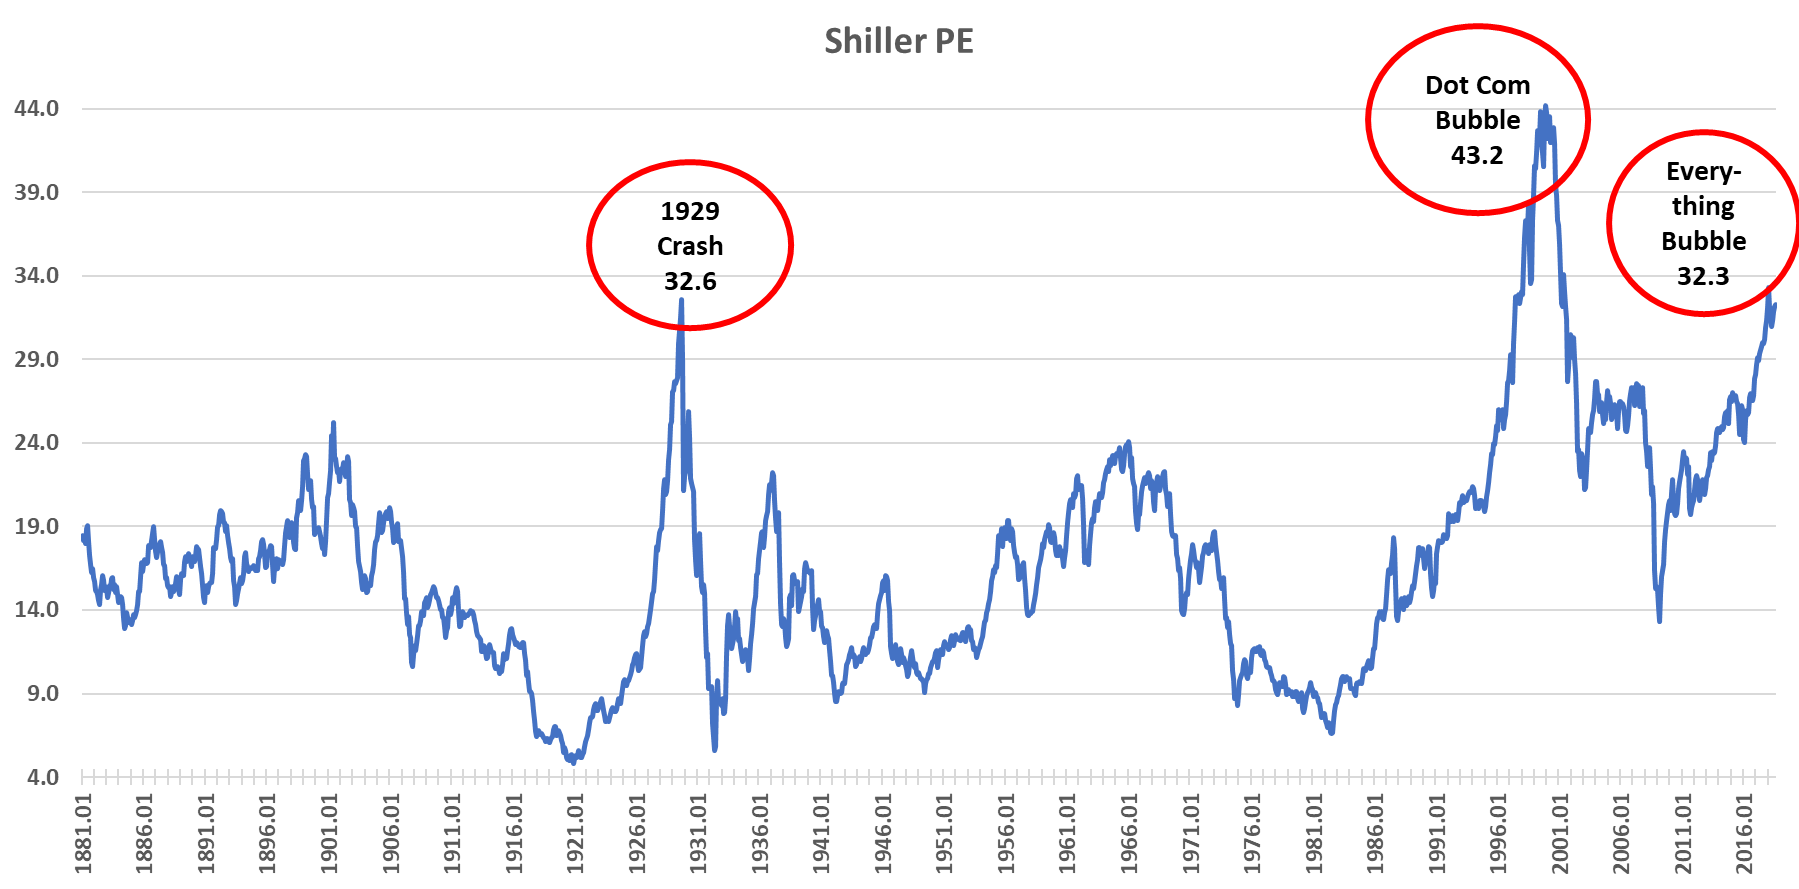
Data Source: www.econ.yale.edu
The housing market is close to a bubble level again. The Case-Shiller National Home Price Index has exceeded the peak of the prior housing crisis by about 10%. The housing affordability measured by the ratio of Case/Shiller Home Price Index and US Median Annual Income has reached 4.5, which means currently the average home price is 4.5 times of median annual income.
