
By RiverFront Investment Group, Rod Smyth (Director of Investments), Kevin Nicholson (CFA, Global Fixed Income Co-CIO), Chris Konstantinos (CFA, Chief Investment Strategist), Doug Sandler (CFA, Head of Global Strategy), Rebecca Felton (Senior Market Strategist), Rob Glownia (CFA, Senior Portfolio Manager)
- We believe the Price Matters® framework is a valuation gauge, not a timing tool.
- US Large-Cap stocks are roughly 30% above trend, but not at extremes.
- History shows a wide range of outcomes when starting 30% above trend.
- Thus, our current outlook for earnings and interest rates is important.
FROM CURRENT LEVELS, FORECASTING A LOWER THAN AVERAGE 10-YEAR RATE OF RETURN IS PRUDENT, BUT HISTORY SHOWS A WIDE RANGE OF OUTCOMES.
A forecasting tool for long-term returns: Our Price Matters® framework is a way of looking at the long-term history of stocks to get a guide as to the 10-year outlook for future returns. We do not believe it is a timing tool. The premise is this: Since 1926, US Large-Cap stocks, defined as the largest 20% of the CRSP total stock universe, has had a consistent trendline of 6.4% when we look at total returns (price plus reinvested dividends) net of inflation (Consumer Price Index, CPI). This history is shown in the first chart below. In our opinion, the consistency of this rate of return over such a long period makes it a valuable tool in putting current levels in a historical context.
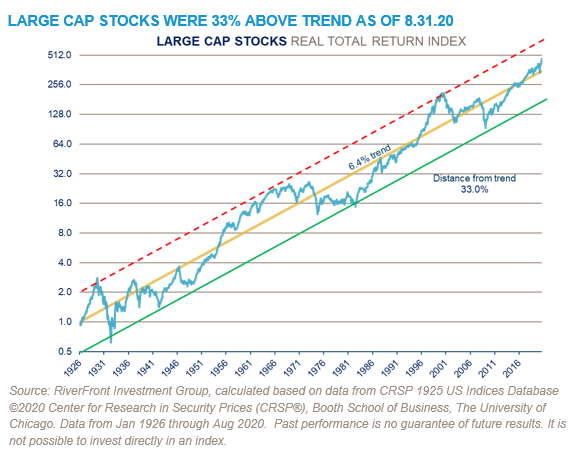
Opportunities at extremes: Given the history of reverting to this trend, investors should consider lowering their return forecasts as stocks rise above the trend and increasing their return forecasts as stocks fall below the trend. However, in our experience, this framework is most valuable at extremes. We seek to illustrate this in the chart above. The red dotted line parallels the trend but is drawn through previous peaks in 1929, 1966 and 1999, all of which preceded meaningful bear markets over the subsequent 10 years. Likewise, the lower solid green line is drawn through the extreme lows of 1932, 1982, and 2009, all of which presented better than average return opportunities as stocks recovered to the long-term trendline. As you can see, these extremes are rare.
What we have learned from our Price Matters® work is that the range of outcomes from less extreme starting points has varied considerably and has been much more dependent on the economic regime. Large-Cap stocks were 33% above trend as of August 31st which, as the chart shows, is not an extreme. We see four previous times in history where stocks began at a similar distance above the long-term trend to the August 2020 level. The 10-year real total returns following these timeframes were very different.

Lessons from four regimes with similar starting points to current levels: The dotted line in the chart above is a parallel line drawn from the August 31, 2020 starting point – 33% above trend. The ovals were all previous times when the distance from trend at the starting date was similar to the August 31st level. While Large Cap stocks were consistently a similar distance at the start, the difference is the economic backdrop during these time periods.
The periods beginning in the late 1930s and late 1990s shown in the 1st and 4th ovals were tumultuous times. The fact that the net effect was relatively flat in both cases seems much less important to us than the 3 and 5-year periods in between. The first period was dominated by WWII. Stocks suffered significant losses in the lead up to the war only to regain all of the losses once investors began to anticipate the allied victory and the immediate aftermath of the war. Given that the first period was dominated by WWII, we do not see it as a useful guide to today’s situation. Similarly, the fourth period involved 3 distinct phases: the tech stock bubble, the post 9/11 recession, and the Real Estate bubble, which ended around 2007. We believe the confluence of these three events were greater drivers of performance than the initial distance above trend.
The two periods which we think may be more helpful to today’s analysis are represented by the 2nd and 3rd ovals. The second oval, which began in the mid-1950s, shows that Large-Cap stocks started above trend and remained so throughout the entire period. In the post-WWII world, with Europe and Asia reeling from the effects of the war, US companies gained global brands in technology, industrial companies, pharmaceuticals, and especially consumer companies from soft drinks to fast food to household products. It was also a time of low inflation. One might call it the first ‘golden age’ of American globalization. There are parallels to today, another time of US dominance, especially in the world of technology and the consumer businesses which utilize that technology. While overall global economic growth has been sluggish, growth in US Large-Cap earnings, especially the earnings of large technology companies have been strong.
The third oval, which began in the early 1970s, was the opposite of the second. This was a period dominated by sharply rising inflation and interest rates which led to very poor returns from US Large-Cap stocks, especially net of inflation. At the beginning of the period, inflation was in the low single digits and by the end had risen to double digit levels. In contrast to the 1970s, we believe current interest rates and inflation are set to stay low for a long period of time. The economy is still recovering from the COVID-19 recession and the Federal Reserve has indicated that it expects interest rates to remain at zero through 2023. We believe it is expectations for earnings growth from many of the US’s largest companies, especially those in technology and tech-based consumer businesses, that has driven Large-Cap stocks above trend.
We continue to like these growth companies, while recognizing that their higher valuations make them more vulnerable to disappointments. If our outlook on either growth for these companies or the outlook for inflation and interest rates changes, then the fact that stocks are starting 33% above trend would increase our concerns about the magnitude of the next bear market.
In conclusion: We believe this is a time where assessing the short and medium-term outlook is more important than making a 10-year forecast. The wide range of potential outcomes discussed in this piece highlights why we believe a multi-faceted approach is warranted. In our view, the Price Matters® framework should be a tool best used in combination with our judgement regarding the outlook for the economy, earnings, and interest rates.
Originally published by RiverFront Investment Group, 10/12/20
Important Disclosure Information
The comments above refer generally to financial markets and not RiverFront portfolios or any related performance. Opinions expressed are current as of the date shown and are subject to change. Past performance is not indicative of future results and diversification does not ensure a profit or protect against loss. All investments carry some level of risk, including loss of principal. An investment cannot be made directly in an index.
Chartered Financial Analyst is a professional designation given by the CFA Institute (formerly AIMR) that measures the competence and integrity of financial analysts. Candidates are required to pass three levels of exams covering areas such as accounting, economics, ethics, money management and security analysis. Four years of investment/financial career experience are required before one can become a CFA charterholder. Enrollees in the program must hold a bachelor’s degree.
Information or data shown or used in this material was received from sources believed to be reliable, but accuracy is not guaranteed.
This report does not provide recipients with information or advice that is sufficient on which to base an investment decision. This report does not take into account the specific investment objectives, financial situation or need of any particular client and may not be suitable for all types of investors. Recipients should consider the contents of this report as a single factor in making an investment decision. Additional fundamental and other analyses would be required to make an investment decision about any individual security identified in this report.
In a rising interest rate environment, the value of fixed-income securities generally declines.
Investing in foreign companies poses additional risks since political and economic events unique to a country or region may affect those markets and their issuers. In addition to such general international risks, the portfolio may also be exposed to currency fluctuation risks and emerging markets risks.
Stocks represent partial ownership of a corporation. If the corporation does well, its value increases, and investors share in the appreciation. However, if it goes bankrupt, or performs poorly, investors can lose their entire initial investment (i.e., the stock price can go to zero). Bonds represent a loan made by an investor to a corporation or government. As such, the investor gets a guaranteed interest rate for a specific period of time and expects to get their original investment back at the end of that time period, along with the interest earned. Investment risk is repayment of the principal (amount invested). In the event of a bankruptcy or other corporate disruption, bonds are senior to stocks. Investors should be aware of these differences prior to investing.
Market Cap index information calculated based on data from CRSP 1925 US Indices Database ©2020 Center for Research in Security Prices (CRSP®), Booth School of Business, The University of Chicago.
Used as a source for cap-based portfolio research appearing in publications, and by practitioners for benchmarking, the CRSP Cap-Based Portfolio Indices Product data tracks micro, small, mid- and large-cap stocks on monthly and quarterly frequencies. This product is used to track and analyze performance differentials between size-relative portfolios.
CRSP ranks all NYSE companies by market capitalization and divides them into ten equally populated portfolios. Alternext and NASDAQ stocks are then placed into the deciles determined by the NYSE breakpoints, based on market capitalization. The series of 10 indices are identified as CRSP 1 through CRSP 10, where CRSP 10 has the largest population and smallest market-capitalization. CRSP portfolios 1-2 represent large cap stocks, portfolios 3-5 represent mid-caps and portfolios 6-10 represent small caps.
RiverFront’s Price Matters® discipline compares inflation-adjusted current prices relative to their long-term trend to help identify extremes in valuation.
Index Definitions:
The Consumer Price Index (CPI) is a measure of the average change over time in the prices paid by urban consumers for a market basket of consumer goods and services. Indexes are available for the U.S. and various geographic areas. Average price data for select utility, automotive fuel, and food items are also available.
RiverFront Investment Group, LLC (“RiverFront”), is a registered investment adviser with the Securities and Exchange Commission. Registration as an investment adviser does not imply any level of skill or expertise. Any discussion of specific securities is provided for informational purposes only and should not be deemed as investment advice or a recommendation to buy or sell any individual security mentioned. RiverFront is affiliated with Robert W. Baird & Co. Incorporated (“Baird”), member FINRA/SIPC, from its minority ownership interest in RiverFront. RiverFront is owned primarily by its employees through RiverFront Investment Holding Group, LLC, the holding company for RiverFront. Baird Financial Corporation (BFC) is a minority owner of RiverFront Investment Holding Group, LLC and therefore an indirect owner of RiverFront. BFC is the parent company of Robert W. Baird & Co. Incorporated, a registered broker/dealer and investment adviser.
To review other risks and more information about RiverFront, please visit the website at www.riverfrontig.com and the Form ADV, Part 2A. Copyright ©2020 RiverFront Investment Group. All Rights Reserved. ID 1363729
