

Last week was a busy week for the markets. Tuesday was almost an outlier day, and both Apple and Amazon reported earnings, which yielded very different results for their share prices. The markets are in a very interesting spot. Let’s quickly dive in on a few points.
Almost an Outlier Day
Markets fell for the first four days of August. You may have read or heard that the months of August and September are typically weak for stocks. So, with markets falling last week, the question is, “is volatility starting to pick back up?”
Wednesday’s trading day was almost, but not quite, an outlier day. An outlier day is defined as any trading day beyond +/-1.50%. Several outlier days are a sign of rising market volatility. The S&P 500 has not seen an outlier day since late April. Wednesday saw the market index finish down -1.39% on average volume. Not a whole lot to see there. I think that the trading day felt large because it was the first time that the S&P 500 had fallen by more than -1.00% in since May. For volatility to begin picking up in the markets, there would need to be a few outlier days, which would most likely occur in a cluster.
Apple and Amazon
While volatility in the market indexes appears muted, volatility in a few larger securities is beginning to pick up. As noted earlier, both Apple and Amazon reported earnings after market close on Thursday. Those stocks’ Friday fluctuations saw very different results.
Apple, which is the largest stock in many major market indexes (accounting for 7% of the S&P 500 and 22% of the Information Technology sector), fell -4.80% on heavy volume. Investors were eager to liquidate large quantities of shares at a lower price. It erased all the gains it had previously made since early June. That decline continued into Monday. A large gap down (meaning the high for the day is lower than the prior day’s low) coupled with heavy volume, particularly after a significant run-up, is a sign of higher risk for the stock.
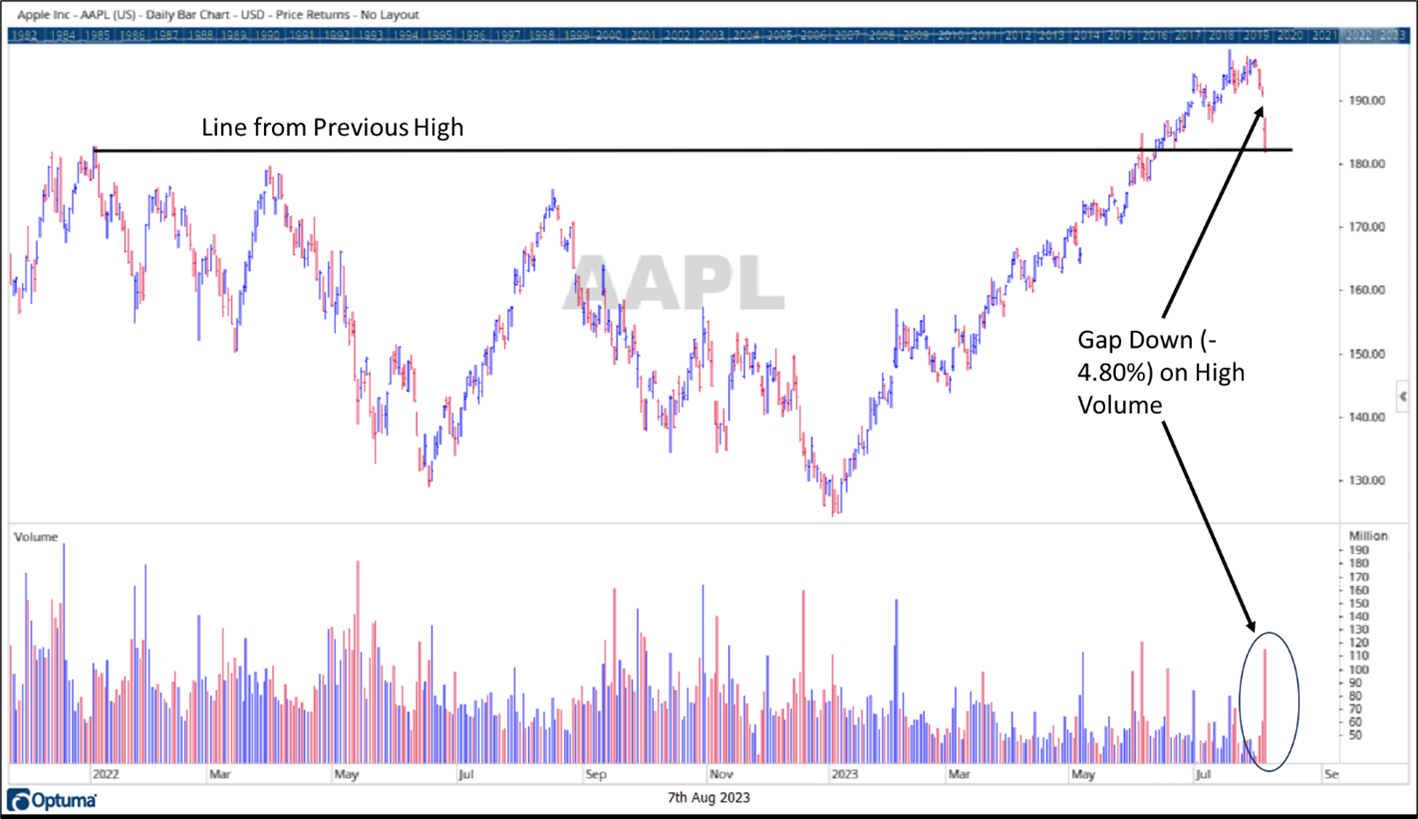
Source: Canterbury Investment Management. Chart created using Optuma Technical Analysis Software
Friday was a “Tale of Two Stocks.” While Apple saw a sharp decline, Amazon (3rd largest S&P 500 stock) saw a large “pop” to the upside for more than +8%. At one point during the trading day on Friday, AMZN was up +10% and almost matched its previous peak from a year ago. The big question here is “will that peak act as a point of resistance?” After matching that high, the stock sold off into the market’s close. This will be a stock to keep an eye on. “Gaps up” are usually a good sign, but stocks will often waver sideways for a few weeks following a large, single-day move.

Source: Canterbury Investment Management. Chart created using Optuma Technical Analysis Software
Bonds
We all know the conventional wisdom: bonds are safer than stocks. Last year was a harsh reminder for the conservative investor that bonds can have bear markets too. When interest rates increase, bond prices go down. Since late November, treasury bonds have been in a sideways trading range, fluctuating between points of support (where prices typically go higher) and points of resistance (where prices typically fall). These support and resistance lines are where supply and demand shift. Last week, it appeared that long-term treasuries broke support and are now in need of finding some footing. The long-term treasury bond ETF is now down more than -40% from its peak three years ago.

Source: Canterbury Investment Management. Chart created using Optuma Technical Analysis Software
Bottom Line
As a whole, the market has not seen much of an increase in volatility. Some of its underlying components, however, are starting to see volatility rise. Most of the downward volatility on Friday, caused by Apple’s stock, was offset by Amazon’s large pop to the upside.
As a stock, Apple has the greatest impact on the S&P 500 and is larger than the smallest 197 S&P 500 stocks combined. Amazon is the third largest index component. Following the gap up, this stock is at a potential area of resistance. From here, it would be normal for this stock to move in a sideways pattern.
If the market’s largest technology stocks start to falter, as Apple did on Friday, it will put the markets in a vulnerable position. In order for the market’s volatility to remain stable, other sectors would have to pick up the slack. As a potential example of sector strength rotation, one sector that is starting to show some promise is the Energy sector. As a group, this sector recently crossed above its 200-day moving average, has seen volatility decline over the last several months, and its relative strength to the S&P 500 has ticked up over the last month.
We will conclude this update with a quick note on diversification. Diversification is a key component to portfolio management. As we showed above, bonds have not been a great diversifier. Bonds are in a bear market and have seen significant declines. Effective diversification in today’s market environment differs from what it was last year or the last decade. Diversification should be adaptive. In other words, if technology stocks start to get shaky, an Adaptive Portfolio will rotate its positions and adjust to the new market environment. An adaptive portfolio will also hold positions that are not as correlated to typical market fluctuations. The goal is to create stable portfolio volatility, regardless of what is happening in the markets.