
By David M. Haviland, Beaumont Capital Management
What does a typical Bear market look like? How long do they last? When are the majority of the losses incurred? Most investors believe that the losses occur fairly evenly throughout the Bear. Based on the past, with one notable exception, nothing could be further from the truth. In our last educational paper on Bear markets, Tactical to Practical: Understanding the Importance of Market Declines, we wrote about the types, frequency, severity and duration of market declines. As a refresher, here are the results:
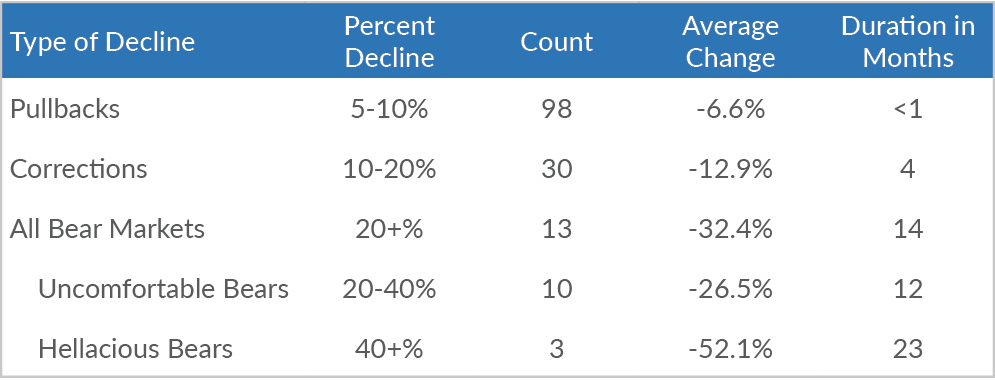
Source: Bloomberg, Beaumont Capital Management (BCM). Data as of 9/30/18 and does not include the current drawdown which has not ended.
Now let’s dig into what we really want to talk about: the anatomy of past Bear markets.
First, Black Monday in October 1987 was the exception. The vast majority of the losses occurred in one day; in fact, the 22.6% loss was the largest one-day percentage drop in the history of the Dow Jones Industrial Average. In my opinion, this was truly the first “flash crash” as the computers of the day were selling ahead of their human counterparts. There were no governors or rules limiting the computer trading at the time and this exacerbated the fall. Regardless of the cause, this Bear was unlike any other in the post WWII era.
As the chart above shows, most Bear markets take time. It takes a year or two to lose such a large percentage of your portfolio. Yet within this timeframe, the losses are not evenly distributed. The chart below breaks down the average Bear market for the S&P 500 Index. What is striking is that most of the losses occur during the beginning and the end of the Bear, and that the losses occur faster during the beginning and end.
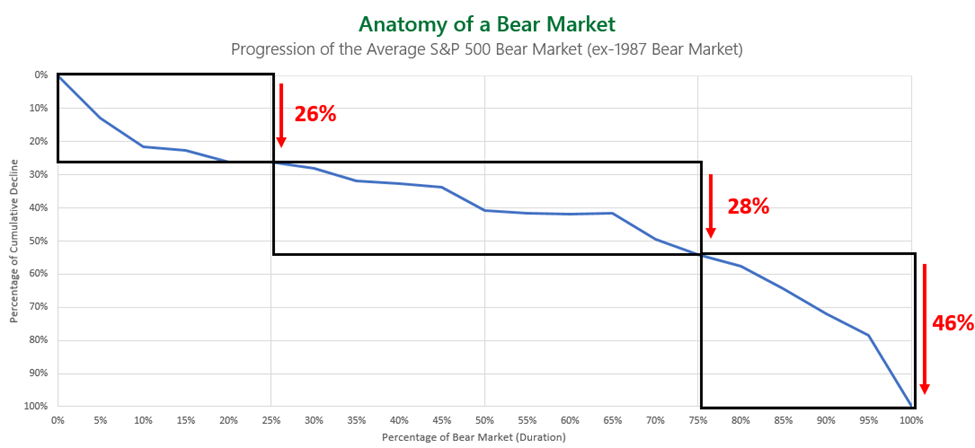
Source: Bloomberg, Beaumont Capital Management (BCM). The chart shows the distribution of losses throughout the progression of the average S&P 500 bear market (with dividends reinvested) since the end of WWII, excluding the 1987 bear market.
Every Bear starts as an ordinary pullback, grows into a Correction and then continues into a Bear. Ordinary pullbacks tend to be sharp and quick, so it makes sense that the beginning of a Bear shares this trait. Of all Bear markets since WWII (except 1987), the first quarter of the Bear market declines ~9% on average, the upper range of the Ordinary Pullback. On average, the first quarter of a Bear will incur about 26% of the total Bear market drawdown (source: see chart source above).
The next phase, or the next half of the Bear including the second and third quarters, is more of a complacency period. Combined, the average losses in this phase is -28%. The Bear takes its time. It pulls you in. There are recovery rallies sprinkled in giving hope. The shallower downward slope does not compel action but by the end of the third quarter the Bear has essentially doubled your loss. Complacency turns to denial. Lots of investors stop opening their statements. And then it happens.
Almost half of Bear market losses, 46% on average, occur during the final panic and capitulation stages of the Bear. During this final quarter, the declines tend to accelerate, and the markets start to cascade down. Even the most resolute investors have doubts. People freeze with fear not knowing what to do, and then most reach their breaking point. Emotions, particularly fear, begin to take control and fear about future goals, such as education and retirement, becoming unachievable grow unbearable (pun intended). Most investors capitulate and sell at or near the bottom.
What is the lesson? Investment math teaches us to keep our losses small. The larger a loss becomes, the greater the gain the remaining assets in the portfolio need just to get back to even.
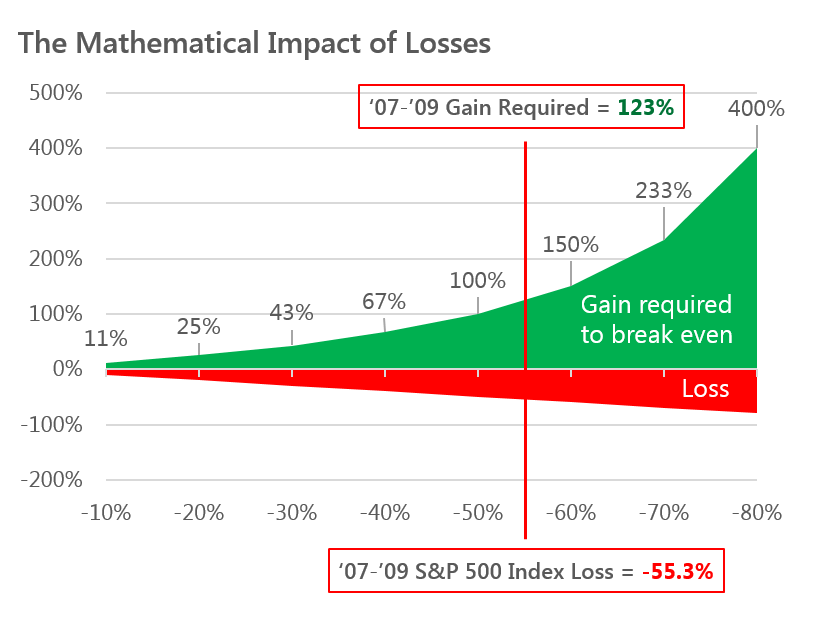
Source: Bloomberg. Loss shown for S&P 500 Index is based on daily pricing and includes dividends reinvested from peak to trough for the most recent Bear market (time period 10/9/2007-3/9/2009).
Another lesson is to acknowledge the shape of a Bear and the length of time it takes to unfold. As we mentioned above, the first 10% or so is almost impossible to avoid as it is quick and most often just an ordinary pullback. But as losses extend, it is time to re-assess. Taking action before your losses leave the teens is quite easy to recover from as the loss diagram above illustrates. Keep your losses small and don’t be afraid sell into a rally.
