
By Rod Smyth, Chairman of the Board of Directors
SUMMARY
- Since January 2020 the S&P 500 is up 41.4% and earnings are projected to be 37% higher (2022 estimates).
- Going forward we expect both earnings growth and stock prices to rise more slowly.
- Looking ahead, we offer advice tailored to Accumulate, Sustain, and Distribute investors.
Advice for Accumulate, Sustain, and Distribute Investors
A year ago on August 21st, the S&P 500 surpassed its pre-COVID-19 high of 3397. Many thought that was a remarkable feat given the news at the time. It is now at a record high of 4468 (as of August 16, 2021) roughly one year later. The stock market has, as it often does, been the most astute forecaster of the economy and corporate earnings. Due to exceptionally low interest rates providing a miserable alternative, stocks have anticipated and ‘pulled forward’ the outlook for continued gains in earnings.
Let’s pause for a minute and reflect on that. Prior to the COVID-19 pandemic, the S&P 500 was enjoying an exceptional decade of gains, (following more than a decade of flat returns starting in 2000, a period sometimes known as the ‘lost decade’). In January 2020 stocks seemed reasonably valued to us, with the S&P 500 at 3230. In our 2020 outlook we were expecting 6-8% gains for the year, with 15% or more in our optimistic case. Optimism prevailed, despite the pandemic and the return of the S&P 500 was just over 16% in price terms for 2020. So far in 2021 the S&P 500 has added another 19% an amount few, including us, were forecasting. If the last 18 months have taught us anything it is surely the danger of relying too much on forecasts, and of reacting emotionally to events. This re-enforces our mantra of ‘process over prediction’ as our balanced portfolios have been overweight stocks for all of 2021.
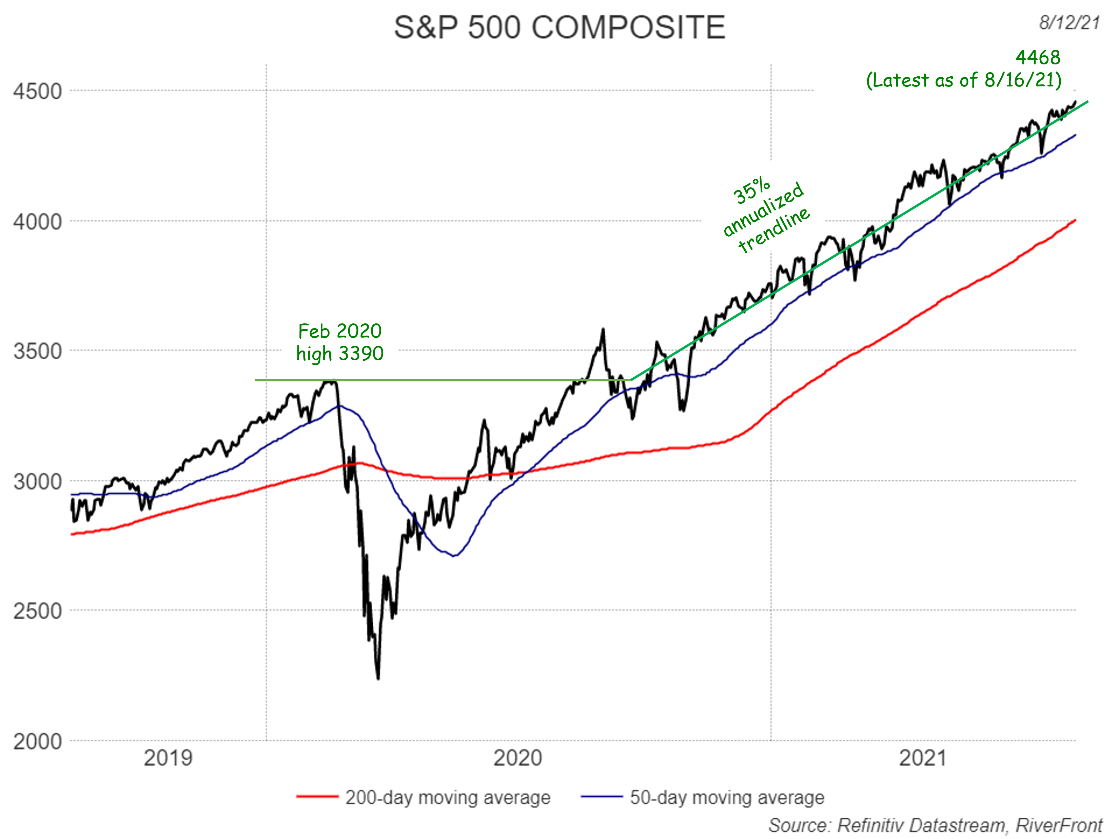
All of this is illustrated in the chart above which shows the price of the S&P 500, its longer-term moving average (200-day) and it’s shorter-term 50-day moving average. We highlight the pre-COVID-19 high, the breakout above that high and the current trend since that time. We think it illustrates just how exceptional this period has been. The total return, including dividends, of the S&P 500 is 41.4% since January 1st, 2020, rewarding investors who have held on during the pandemic. In the chart we have also drawn a trend line to capture the current annualized rate of advance which has been 35% since early November 2020 right around the election, showing that the market is neither ‘red or ‘blue’ but responds mostly to earnings and interest rates. Current estimates for S&P 500 2022 earnings are $215, and this year is now expected to come in at $195.61. By way of context, earnings for 2019 and 2020 were $157 and $122 respectively. With earnings projected to be 37% higher than the 2019 pre-COVID-19 peak, the market’s 41.4% rise becomes more understandable. That said, we recognize that, with earnings growth slowing, the rapid trend line of the last 9 months is unlikely to be sustained for much longer, and at some point the pace of advance will slow to a more reasonable rate. This can occur by a period of sideways movement such as occurred in September and October last year or by a sharper correction.
We believe this has been a great time to be a stock investor but what now? We offer advice to our 3 client profiles Accumulate, Sustain, and Distribute.
Sustain and Distribute investors: Sustain investors are those in the period leading up to retirement and Distribute investors are those taking distributions in retirement. We suggest both groups, especially Distribute investors take advantage of the market’s strength to rebalance portfolios to your desired long-term mix if you have not done so. Think of it this way, the market has already paid for some of your spending needs in advance and we think it is prudent to lock in those gains. How would this work? In a hypothetical example let us assume an investor had $100 in a 60/40 mix of stocks and bonds as of January 1, 2020. The $60 in stocks is now worth $84.8 (+41.4%). In the same timeframe the Barclays Aggregate Index of bonds has gained 6.3% and so the $40 in bonds is now worth $42.5. Thus, the original $100 is now worth a total of $127.3 and the stock bond ratio is now 67/33. To maintain a 60/40 mix the investor would need to reduce their stock holdings, thereby locking in the gains. In RiverFront’s asset allocation portfolios this kind of rebalancing happens regularly and any deviation from our benchmarks is due to a deliberate tactical decision by the portfolio team.
Accumulate investors are those saving for retirement or other goals. Our advice for Accumulate investors is to invest systematically to take advantage of market declines as well as market advances. We call this ‘dollar cost averaging’. Many Accumulate investors fear bear markets when they see the value on their statements decline. We understand this can be emotional, however our message is to look at it differently and embrace those declines as an opportunity to buy at lower levels. Those who bought all the way through 2020 experienced exactly this.
In conclusion:
The last 20 months has been an extraordinary one for investors. We assert that no one could have predicted the magnitude of the decline in Q1 2020 or the strength and duration of the gains since that quarter. Our process has helped us navigate through a journey that we could not have anticipated and has increased our confidence in combining fundamental research with a tactical overlay. We think stocks will be higher in the next 18 months but will not continue rising at the same pace and may need to move sideways for a quarter or two at some point to consolidate the gains already made. We believe the stock market will continue take its cue from interest rates and expected earnings giving us a good read on the path of both. We suggest Sustain and Distribute investors rebalance portfolios whose allocation has deviated from long term plans and encourage Accumulate investors to continue dollar cost averaging and observe how it can work in volatile markets.
Important Disclosure Information
The comments above refer generally to financial markets and not RiverFront portfolios or any related performance. Opinions expressed are current as of the date shown and are subject to change. Past performance is not indicative of future results and diversification does not ensure a profit or protect against loss. All investments carry some level of risk, including loss of principal. An investment cannot be made directly in an index.
Chartered Financial Analyst is a professional designation given by the CFA Institute (formerly AIMR) that measures the competence and integrity of financial analysts. Candidates are required to pass three levels of exams covering areas such as accounting, economics, ethics, money management and security analysis. Four years of investment/financial career experience are required before one can become a CFA charterholder. Enrollees in the program must hold a bachelor’s degree.
Information or data shown or used in this material was received from sources believed to be reliable, but accuracy is not guaranteed.
This report does not provide recipients with information or advice that is sufficient on which to base an investment decision. This report does not take into account the specific investment objectives, financial situation or need of any particular client and may not be suitable for all types of investors. Recipients should consider the contents of this report as a single factor in making an investment decision. Additional fundamental and other analyses would be required to make an investment decision about any individual security identified in this report.
In a rising interest rate environment, the value of fixed-income securities generally declines.
When referring to being “overweight” or “underweight” relative to a market or asset class, RiverFront is referring to our current portfolios’ weightings compared to the composite benchmarks for each portfolio. Asset class weighting discussion refers to our Advantage portfolios. For more information on our other portfolios, please visit www.riverfrontig.com or contact your Financial Advisor.
Stocks represent partial ownership of a corporation. If the corporation does well, its value increases, and investors share in the appreciation. However, if it goes bankrupt, or performs poorly, investors can lose their entire initial investment (i.e., the stock price can go to zero). Bonds represent a loan made by an investor to a corporation or government. As such, the investor gets a guaranteed interest rate for a specific period of time and expects to get their original investment back at the end of that time period, along with the interest earned. Investment risk is repayment of the principal (amount invested). In the event of a bankruptcy or other corporate disruption, bonds are senior to stocks. Investors should be aware of these differences prior to investing.
Index Definitions:
Standard & Poor’s (S&P) 500 Index TR USD (Large Cap) measures the performance of 500 large cap stocks, which together represent about 80% of the total US equities market.
Bloomberg Barclays US Aggregate Bond Index TR USD (Fixed Income Investment Grade) is an unmanaged index that covers the investment grade fixed rate bond market with index components for government and corporate securities, mortgage pass-through securities, and asset-backed securities. The issues must be rated investment grade, be publicly traded, and meet certain maturity and issue size requirements.
RiverFront Investment Group, LLC (“RiverFront”), is a registered investment adviser with the Securities and Exchange Commission. Registration as an investment adviser does not imply any level of skill or expertise. Any discussion of specific securities is provided for informational purposes only and should not be deemed as investment advice or a recommendation to buy or sell any individual security mentioned. RiverFront is affiliated with Robert W. Baird & Co. Incorporated (“Baird”), member FINRA/SIPC, from its minority ownership interest in RiverFront. RiverFront is owned primarily by its employees through RiverFront Investment Holding Group, LLC, the holding company for RiverFront. Baird Financial Corporation (BFC) is a minority owner of RiverFront Investment Holding Group, LLC and therefore an indirect owner of RiverFront. BFC is the parent company of Robert W. Baird & Co. Incorporated, a registered broker/dealer and investment adviser.
To review other risks and more information about RiverFront, please visit the website at www.riverfrontig.com and the Form ADV, Part 2A. Copyright ©2021 RiverFront Investment Group. All Rights Reserved. ID 1761117
