

By Chris Konstantinos, CFA
SUMMARY
- The S&P 500 made a new all-time high recently.
- New all-time highs have been historically bullish for stocks.
- We remain constructive on the US stock market.
New Highs are Bullish, not Bearish for Stocks
“The only thing we have to fear…is fear itself” – President Frankin Delano Roosevelt
A New All-Time High in the Market: Nothing to Fear
Not even a month into the new year, the S&P 500 has made a new all-time closing high at 4839.81 on January 19…just over two years (and 500+ trading days) from the previous record high made on January 3, 2022. This milestone may have caused many investors to nervously wonder what might come next. History suggests to us that investors generally have little to fear – and actually much to celebrate – with the advent of an all-time high.
New Highs Are Generally a Bullish Sign
Our friends at Ned Davis Research (NDR) have performed what we consider to be definitive analysis of historical market returns following all-time highs (defined by NDR as at least a year from the prior record peak), looking at a period from 1954 to 2016. The data is relatively clear: S&P 500 performance following a record high tends to be better than average over the next 3, 6, and 12-month period. Looking a year out, markets are higher over 90% of the time, by an average of roughly 14% return, compared to a long run average return of 7.5% across all periods (see table, below). Simply put, investors’ odds of positive returns over the short-to-intermediate time period are better, not worse after a record high.
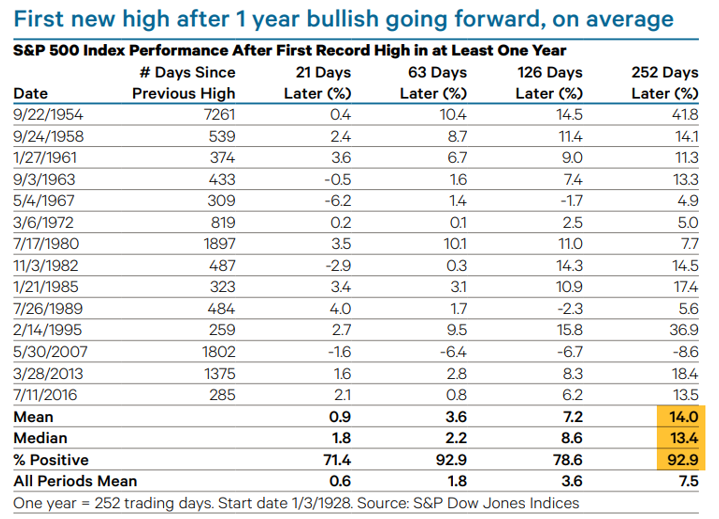
Copyright 2023 Ned Davis Research, Inc. Further distribution prohibited without prior permission. All Rights Reserved. See NDR Disclaimer at ndr.com/copyright.html. For data vendor disclaimers refer to ndr.com/vendorinfo/. Past performance is no guarantee of future results. Shown for illustrative purposes.
The only occasion where returns were negative was the 2007 high, just prior to the collapse of the financial system in 2008. With the US consumer and corporate sector in much stronger financial shape, we do not believe the current backdrop is similar to ’07.
Another quantitative way to view stock market ‘breakouts’ is to analyze historical market outcomes when both short-term and intermediate-term price momentum is positive, as it is today[1]. RiverFront has built a proprietary ‘heatmap’ analysis, which combines primary trend slope and sentiment data to gauge market probabilities based on large-cap US stock prices going back to 1928. The heatmap currently suggests to us a higher-than-average probability of positive market returns over the next 3 months, as well as higher-than-median returns. We believe that this is a sign that strong momentum generally tends to beget more momentum in markets.
Conclusion: We Remain Constructive on US Stocks
Seasoned investors are emotionally trained to be suspicious of good things, and constantly looking for what could go wrong…especially after some of the historic market dislocations experienced since the turn of the century. On the face of it, there’s plenty of things for nervous people to worry about in ‘24: Fed policy uncertainty, a contentious Presidential election, a weak Chinese economy, and an equity rally with ‘narrow’ leadership, a phenomenon we addressed last year (see Weekly View, “Narrow Markets are not a Bad Omen for Stocks”, 06/20/23).
We do not lightly dismiss these near-term concerns. On the contrary, if the market follows a typical Presidential election year pattern, the first half of 2024 is likely to be choppy and volatile before eventually resolving to the upside later in the year. Thus far, the start of the year has exceeded our expectations, but there’s still a lot of time left in the year for a few scares.
However, even incorporating all these risks, our 2024 Outlook remains optimistic on US stocks. We place approximately a 75% probability of positive returns this year, with a ‘Base Case’ total return in the mid-single digits from current levels. This view is due in large part to the resiliency of the US corporate sector, which we expect to generate positive earnings growth again this year, as well as the positive election year historical patterns mentioned above.
In our Outlook’s highest probability case, inflation continues to cool at an uneven pace, allowing equity markets to moderately continue their uptrend, albeit in a choppy fashion. Given this backdrop, we believe our ‘P.A.T.T.Y’ theme (‘Pay Attention to the Yield’ – a focus on investments with strong yields and cash flows to support them) will be an effective strategy for ‘24. Specifically, growth stocks with stable and growing free cash flow, cyclical stocks with well-funded dividends, and alternative yield strategies designed to benefit from market volatility are all viable themes under such a scenario.
From a portfolio construction perspective, we continue to slightly favor stocks over bonds in our balanced portfolios. We currently favor US stocks across our balanced portfolios and are tactically cautious on international.
[1] For the purposes of this analysis, RiverFront would define ‘short-term price momentum’ as a Relative Strength Index reading above 50 on the S&P 500, and ‘intermediate-term price momentum’ as a positive slope on the S&P 500’s 200-day moving average.
Risk Discussion: All investments in securities, including the strategies discussed above, include a risk of loss of principal (invested amount) and any profits that have not been realized. Markets fluctuate substantially over time, and have experienced increased volatility in recent years due to global and domestic economic events. Performance of any investment is not guaranteed. In a rising interest rate environment, the value of fixed-income securities generally declines. Diversification does not guarantee a profit or protect against a loss. Investments in international and emerging markets securities include exposure to risks such as currency fluctuations, foreign taxes and regulations, and the potential for illiquid markets and political instability. Please see the end of this publication for more disclosures.
Important Disclosure Information:
The comments above refer generally to financial markets and not RiverFront portfolios or any related performance. Opinions expressed are current as of the date shown and are subject to change. Past performance is not indicative of future results and diversification does not ensure a profit or protect against loss. All investments carry some level of risk, including loss of principal. An investment cannot be made directly in an index.
Information or data shown or used in this material was received from sources believed to be reliable, but accuracy is not guaranteed.
This report does not provide recipients with information or advice that is sufficient on which to base an investment decision. This report does not take into account the specific investment objectives, financial situation or need of any particular client and may not be suitable for all types of investors. Recipients should consider the contents of this report as a single factor in making an investment decision. Additional fundamental and other analyses would be required to make an investment decision about any individual security identified in this report.
The comments above are subject to change and are not intended as investment recommendations. There is no representation that an investor will or is likely to achieve positive returns, avoid losses or experience returns as discussed for various market classes.
Chartered Financial Analyst is a professional designation given by the CFA Institute (formerly AIMR) that measures the competence and integrity of financial analysts. Candidates are required to pass three levels of exams covering areas such as accounting, economics, ethics, money management and security analysis. Four years of investment/financial career experience are required before one can become a CFA charterholder. Enrollees in the program must hold a bachelor’s degree.
All charts shown for illustrative purposes only. Technical analysis is based on the study of historical price movements and past trend patterns. There are no assurances that movements or trends can or will be duplicated in the future.
Stocks represent partial ownership of a corporation. If the corporation does well, its value increases, and investors share in the appreciation. However, if it goes bankrupt, or performs poorly, investors can lose their entire initial investment (i.e., the stock price can go to zero). Bonds represent a loan made by an investor to a corporation or government. As such, the investor gets a guaranteed interest rate for a specific period of time and expects to get their original investment back at the end of that time period, along with the interest earned. Investment risk is repayment of the principal (amount invested). In the event of a bankruptcy or other corporate disruption, bonds are senior to stocks. Investors should be aware of these differences prior to investing.
In general, the bond market is volatile, and fixed income securities carry interest rate risk. (As interest rates rise, bond prices usually fall, and vice versa). This effect is usually more pronounced for longer-term securities). Fixed income securities also carry inflation risk, liquidity risk, call risk and credit and default risks for both issuers and counterparties. Lower-quality fixed income securities involve greater risk of default or price changes due to potential changes in the credit quality of the issuer. Foreign investments involve greater risks than U.S. investments, and can decline significantly in response to adverse issuer, political, regulatory, market, and economic risks. Any fixed-income security sold or redeemed prior to maturity may be subject to loss.
Investing in foreign companies poses additional risks since political and economic events unique to a country or region may affect those markets and their issuers. In addition to such general international risks, the portfolio may also be exposed to currency fluctuation risks and emerging markets risks as described further below.
Changes in the value of foreign currencies compared to the U.S. dollar may affect (positively or negatively) the value of the portfolio’s investments. Such currency movements may occur separately from, and/or in response to, events that do not otherwise affect the value of the security in the issuer’s home country. Also, the value of the portfolio may be influenced by currency exchange control regulations. The currencies of emerging market countries may experience significant declines against the U.S. dollar, and devaluation may occur subsequent to investments in these currencies by the portfolio.
Foreign investments, especially investments in emerging markets, can be riskier and more volatile than investments in the U.S. and are considered speculative and subject to heightened risks in addition to the general risks of investing in non-U.S. securities. Also, inflation and rapid fluctuations in inflation rates have had, and may continue to have, negative effects on the economies and securities markets of certain emerging market countries.
Alternative fixed income asset class includes high yield, preferreds, bank loans, currency funds, developed non-US debt, emerging market debt, TIPS, and floaters. Lower-quality fixed income securities found in this category involve greater risk of default or price changes due to potential changes in the credit quality of the issuer. Any fixed-income security sold or redeemed prior to maturity may be subject to loss. Additionally, non-US/emerging market debt assumes the same risks as international investing.
Index Definitions:
Standard & Poor’s (S&P) 500 Index measures the performance of 500 large cap stocks, which together represent about 80% of the total US equities market.
Definitions:
The 200-day simple moving average (SMA) is considered a key indicator by traders and market analysts for determining overall long-term market trends. It is calculated by plotting the average price over the past 200 days, along with the daily price chart and other moving averages.
RiverFront Investment Group, LLC (“RiverFront”), is a registered investment adviser with the Securities and Exchange Commission. Registration as an investment adviser does not imply any level of skill or expertise. Any discussion of specific securities is provided for informational purposes only and should not be deemed as investment advice or a recommendation to buy or sell any individual security mentioned. RiverFront is affiliated with Robert W. Baird & Co. Incorporated (“Baird”), member FINRA/SIPC, from its minority ownership interest in RiverFront. RiverFront is owned primarily by its employees through RiverFront Investment Holding Group, LLC, the holding company for RiverFront. Baird Financial Corporation (BFC) is a minority owner of RiverFront Investment Holding Group, LLC and therefore an indirect owner of RiverFront. BFC is the parent company of Robert W. Baird & Co. Incorporated, a registered broker/dealer and investment adviser.
To review other risks and more information about RiverFront, please visit the website at riverfrontig.com and the Form ADV, Part 2A. Copyright ©2024 RiverFront Investment Group. All Rights Reserved. ID 3356830
For more news, information, and analysis, visit the ETF Strategist Channel.