
By: Nolan Mauk
In the post-pandemic era marked by economic uncertainty, volatility, geopolitical tension, and deglobalization, one thing has been made clear: no market, sector, or asset class is immune to the effects of rapidly changing market cycles. The highest inflation rate since 1981 and the Federal Reserve’s monetary response sent both stocks and bonds tumbling in 2022, while real assets and other alternative investments proved to be a haven for diversified investors. One year later, falling inflation rates sent the stock market roaring back across new all-time highs while alternatives lagged. Within the equity sector, the top three sectors of 2022 (energy, utilities, and consumer staples) were the three worst performers of 2023, while the three worst sectors of 2022 (technology, consumer discretionary, and communication) were the top three just a year later [1]. Since the start of the decade, diversification across asset classes and sectors has been the key to navigating market uncertainties. ETF investing is one of many excellent ways to achieve this.
At Orion, our team has been researching this topic through a study we’ve dubbed “All-Seasons Investing,” which provides a basis for investors to stay diversified, invested, and disciplined regardless of the current market environment. In this study, we looked throughout history at market cycles as if they are “seasons” and studied the performance and behavior of six major asset classes: US equity, international equity, core fixed income, global credit, liquid alternatives, and real assets. The idea behind all-seasons investing is that each asset class reacts differently to various market cycles and trends, and so, through disciplined asset allocation, an all-seasons investor may capture strong returns while mitigating downside risk (click here and here for more all-seasons content). As an important aside, the point of all-seasons investing is not to try to predict the nature of the upcoming season and allocate accordingly. Rather, all-seasons investing is about recognizing that the future is uncertain, and that diversified portfolios are designed to lower volatility in any market cycle.
When selecting ETFs to allocate across the six asset classes, it’s important to consider which asset classes are better targets for passively indexed exposure and which may benefit from alpha-seeking active management. We will get more in-depth with this question throughout the article, but a good rule of thumb is that passive ETFs are more suitable in more efficient markets where information has a higher velocity and is more easily accessible. Alternatively, active management has the potential to produce alpha in less liquid markets, where information asymmetry may provide opportunities for active managers. A Morningstar study found that the three sectors in which active managers have consistently outperformed their benchmarks over the past ten years are emerging markets (a subset of international equity), real estate (real assets), and high-yield bonds (global credit) [2].
This article will walk through each asset class and discuss the role that each plays in a diversified portfolio. From there, we will observe empirical data from the all-seasons study to highlight market cycles in which all-seasons investors have captured strong returns while mitigating downside risk over the past 25 years, while also highlighting examples of ETFs that fit within this framework. Let’s start with US equities.
US Equities
If our only jobs were to convince you to invest in the United States, you’d be done reading this article by now. Boasting the largest economy in the world, the US has been a financial superpower for over 100 years, and especially since the end of WWII. The dollar is the most dominant currency in the world, and the US Treasury Bill is considered the safest financial instrument of all time. The market capitalization of the US stock market makes up 60.5% of the total value in the world markets, and US stocks have had the highest real annualized returns of any country since 1900 (6.5%) [3]. The US is home to some of the largest and fastest growing companies in the world. All seven components of “The Magnificent Seven” stocks, which returned a jaw-dropping 111.3% on average in 2023, are headquartered in the United States [4]. The growth, strength, and relative stability of US equities make this asset class a staple of any diversified portfolio. Equities particularly benefit from seasons with low interest rates, low inflation, and low taxes.
The rule of thumb mentioned earlier is that larger, more liquid markets with accessible information are prime targets of passive investing, and the US market is the gold standard in all those categories – especially when it comes to large-cap stocks. Publicly traded companies are required to disclose all relevant information to investors, and that information is priced into the market with excellent efficiency. The right active managers can still find ways to outperform their benchmarks – especially in mid-cap and small-cap markets – but it is extremely difficult to do so on a consistent basis. Low-cost indexes, such as iShares Russell 3000 ETF (IWV) and Vanguard Total Stock Market ETF (VTI), are examples of investments that provide broad exposure to the US market. To get more granular by size or style: large ETF providers like Vanguard, BlackRock, Fidelity, and Schwab all boast lineups of low-cost passive ETFs so you can craft this allocation any way you like.
International Equities
While the US equity markets have performed strongly over the past decade, there have been plenty of seasons when international equites outperformed their US counterparts. We’ve written recently on several potential catalysts that may lead to international outperformance over the US in the coming years. The first of these catalysts is that with the rise of The Magnificent Seven, the US stock market has become highly concentrated. In fact, these seven companies alone have a higher combined market cap than every country in the world except the US and China:
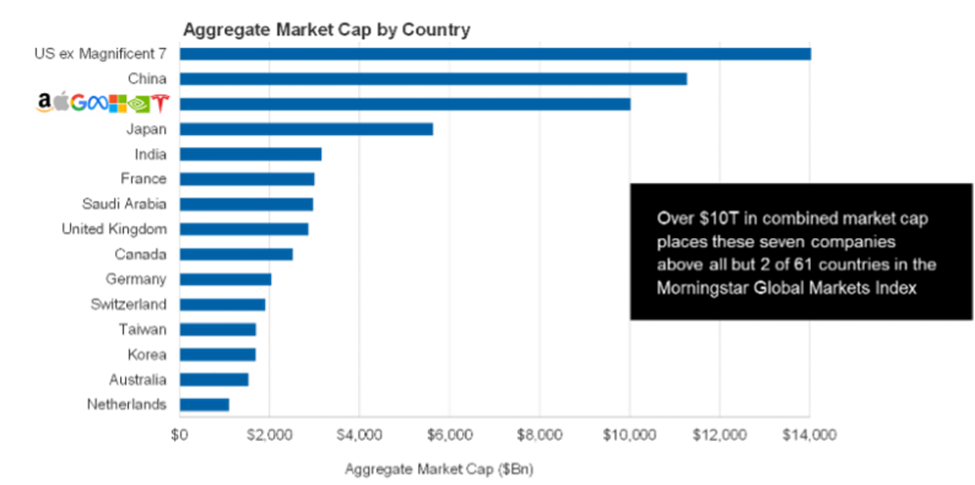
* Source: Myths in Today’s Choppy Markets, Research Affiliates, 2023
While this level of concentration can help to drive growth in years like 2023, a more diversified equity exposure can benefit investors in the event of an arguably overdue correction to these highly correlated stocks.
The second potential catalyst for international outperformance is that the US stock market is expensive. Yale Professor of Economics Robert Shiller’s Cyclically Adjusted Price/Earnings (CAPE) ratio shows that the US stock market is trading at nearly 34x earnings, exactly double its long-term average CAPE ratio of 17 [5]. Empirically, markets trading at this elevated CAPE ratio have not been able to sustain above-average growth in the long term. Outside of recent years, the US market has only been this expensive twice – right before the Great Depression and right before the dot-com bubble burst at the turn of the century. Allocating to international equities gives investors the opportunity to pursue investments with more attractive valuations.
When looking at international equity ETFs, active managers have a much higher chance of generating alpha when investing in emerging markets than they do in developed markets. As stated previously, emerging markets are one of just three sectors that saw active managers consistently outperforming their benchmarks. The smaller market caps and less regulation are precursors to information asymmetry, giving dedicated managers the opportunity to capitalize. Large actively managed ETFs such as JPMorgan ActiveBuilders Emerging Markets Equity ETF (JEMA) and Dimensional Emerging Core Equity Market ETF (DFAE) provide this at a reasonable price. In the developed markets, passive indexes like iShares Core MSCI International Developed Markets ETF (IDEV) and Vanguard FTSE Developed Markets ETF (VEA) could serve as core holdings for low tracking error international beta exposure.
Core Fixed Income
By our definition, the Core Fixed Income asset class is made up of US investment-grade bonds (rated BBB and higher) as well as cash and cash equivalents. We believe this class plays a diversifying role in an asset allocation portfolio by lowering both its correlation and volatility. Bonds have generally been considered an asset class used to hedge against stock market volatility due to their empirically low betas and correlations to stocks. In times of heightened market volatility, some investors may look for safer, more secure places to allocate their money. Moreover, when the economy is in contraction or recession, the Fed often cuts rates to stimulate the economy, making higher coupon rates on existing bonds relatively more attractive, driving prices upward. While this relationship of low correlation is not guaranteed to hold in every stage of the market cycle, we believe it is strong enough to be an essential piece of a diversified portfolio.
Within core fixed income, passive and active ETFs both have their place, but those seeking alpha from active managers should look for managers who have a clear investment philosophy and a track record of empirically outperforming peers and benchmarks. Managers such as PIMCO have had success in this space with their PIMCO Active Bond ETF (BOND). This fund allows the investment team to invest across the fixed income sectors depending on where they are seeing value depending on spreads and market cycles. Firms like Bondbloxx, on the other hand, have found success in the low-cost passive/beta approach with their targeted ETF exposures.
Global Credit
The global credit asset class is made up of US high-yield bonds (rated BB or lower), preferred securities, convertible bonds, and emerging markets debt. This asset class looks to complement the core fixed income class by taking on more risk within the fixed income space. Higher risk levels are rewarded with higher yields, giving investors avenues to both further diversify and achieve strong returns. Like investment-grade bonds, global credit tends to perform better in low inflation and falling interest rate environments.
When selecting ETFs to satisfy a global credit allocation, we believe active management has a role to play. Thinking back to the Morningstar study cited in the beginning of this article, high-yield bonds were one of the few areas that have seen consistent active manager outperformance over passive management. Expertise is important in this asset class. Passively managed products in the high-yield space often use indexes weighted by the outstanding debt of the underlying companies, therefore potentially leaving investors holding a large exposure to highly levered companies. For active investors there are many ETFs from renowned managers such as T. Rowe Price U.S. High Yield ETF (THYF) and WisdomTree Emerging Markets Local Debt Fund ETF (ELD). Investors can target the same exposure from a passive standpoint with large ETFs such as iShares Broad USD High Yield Corporate Bond ETF (USHY) or JPMorgan USD Emerging Markets Bond ETF (EMB).
Liquid Alternatives
The goal of the liquid alternatives asset class is to provide market neutrality and yield to investors without sacrificing liquidity in doing so – as other alternatives do. These strategies include multi-alternative strategies, long/short strategies, managed futures, merger arbitrage, and others. Lower correlation, lower volatility, and potential inflation-hedging properties are the potential benefits of including liquid alts in your asset allocation. Active and passive ETFs both have their role in this space. High liquidity benefits investors through funds like Franklin Systematic Style Premia ETF (FLSP), which is an absolute return fund that employs a multi asset long/short strategy via the use of derivatives. Another popular liquid alternative strategy is called trend following, which tries to take advantage of long, medium, or short-term market moves that may play out in different markets such as equities, currencies, derivatives, and futures, while trying to maintain a beta and correlation to equities of close to zero. Trend following strategies such as Simplify’s Managed Futures ETF (CTA) will run a proprietary strategy, while products like iMGP DBi Managed Futures Strategy (DMBF) will run a replication strategy, where they attempt to recreate the returns and positions of 20 of the most liquid and biggest trend following funds that are tracked by the Société Générale Trend Index.
Real Assets
Investing in real assets is a form of alternative investing that provides access to the cash flows generated by some of the most fundamental and essential pieces of the world economy across a wide variety of sectors (i.e. real estate, infrastructure, natural resources, commodities, and precious metals). These investments are known for their inflation protection characteristics and carry an intrinsic value, as they are directly tied to the underlying value of physical assets. Many real assets pay some sort of yield, rewarding real asset investors with consistent income. The more liquidity investors are willing to give up, the larger and more consistent payments they can generally expect.
We’ve written recently about some current and recent market conditions that make real assets an attractive diversifier to the traditional stock/bond portfolio. Inflation has been in the headlines for close to two years now. While its impacts have been felt across the economy, a lesser-known effect of inflation is a rising correlation between stocks and bonds. In fact, one-year correlation between stocks and bonds recently reached its highest level since 1995 [6]:
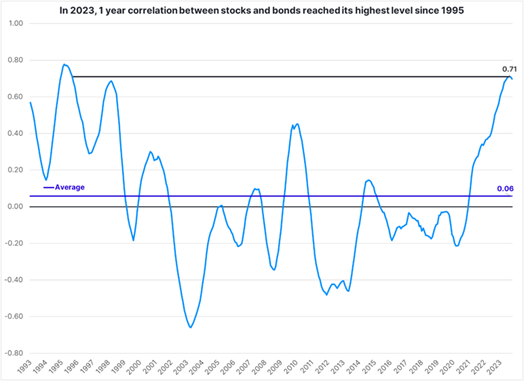
* Source: Morningstar data
This rising correlation reduces the effects of diversification within stocks and bonds – creating a need for additional diversifiers. Real assets do well in filling that void and have empirically played their part when needed.
When thinking about ETFs, we believe the real assets class is one that stands to benefit from active management, as low liquidity and slower moving markets allow for the pursuit of alpha from those in the know through funds such as PIMCO Commodity Strategy Active Exchange-Traded Fund (CMDT) or IQ CBRE Real Assets ETF (IQRA).
Bringing it all together: All-Seasons Investing
Now, what does all-seasons investing look like in practice? In this study we’ve constructed the “seasons” in many ways, including economic, monetary, and broad market trends over three-month periods. From there, we looked at the average trailing twelve-month returns for each asset class in different stages of the market cycles to see how each asset class performed as these conditions were taking shape. First, let’s look at asset class performance through a market and monetary lens, using stock prices and the interest rate environment as our indicators [7]:
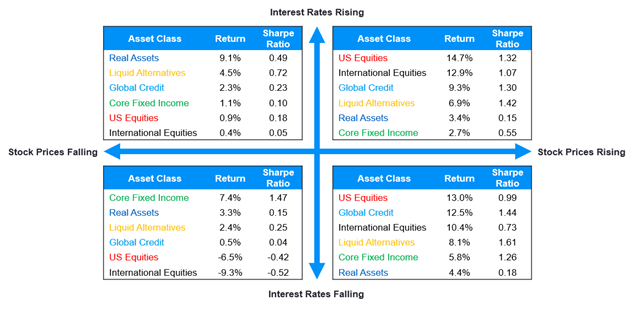
It’s hard to miss the point of this chart. When the market was strong and operating efficiently, riskier investments like equities and global credit thrived, while the diversifiers followed to a lesser extent. Fixed income performed better on a risk-adjusted basis when rates were falling, which is intuitive as well. It is when stocks were falling that the benefits of diversification were apparent. When markets weren’t operating efficiently and volatility was rising, the same risky investments that outperformed when stocks were up highly underperformed, while the diversifiers did their part to protect capital. Real assets strongly outperformed as interest rates rose, presumably a function of their inflation-hedging characteristics. When rates were falling in recessionary times, the fixed income sector rose to the top on both a nominal and risk-adjusted basis. Investors who were not diversified when the markets dipped were exposed to all the downside and none of the upside that comes from market uncertainty and volatility.
Now let’s look at the same study from a more economic perspective and review how these same asset classes performed in different inflationary environments. Inflation has been in the headlines and top-of-mind for investors for the past few years. Investors need to be prepared for inflation, so let’s look at how all-seasons investing takes care of that need [8]:
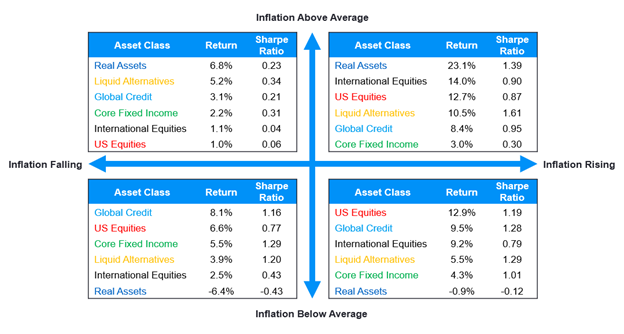
Inflation is a normal part of a healthy, growing economy. However, it can have negative impacts on portfolios and affects different asset classes in different ways. For example, real assets have proven to be an excellent inflation hedge but have lagged riskier assets in low inflation environments, while global credit and US equities tended to benefit from lower inflation.
The all-seasons study has provided us with plenty of conviction to state that deliberately and consistently diversifying across the six main asset classes can help mitigate the downside risk that accompanies certain stages of the market cycle without sacrificing the capture of strong growth that comes in more temperate seasons. Remember to stay invested, stay disciplined, and stay diversified to achieve the benefits of all-seasons investing.
For more news, information, and analysis, visit the ETF Strategist Channel.
References
1: https://novelinvestor.com/sector-performance/
2: https://www.morningstar.com/funds/where-do-active-fund-managers-hold-upper-hand
3: https://www.ubs.com/global/en/investment-bank/in-focus/2024/global-investment-returns-yearbook.html (page 47 of summary)
5: http://www.econ.yale.edu/~shiller/data.htm
6: Source: Morningstar data
7: All figures reflect trailing twelve months. Investment return data is from Morningstar. Yields data is from the Federal Reserve Bank of St. Louis. Monthly data spans from 1/1/1999-1/31/2024. Benchmarks used: US Equities: Russell 3000 TR USD; Int’l Equities: MSCI ACWI Ex USA GR USD; Core Fixed Income: Bloomberg US Agg Bond TR USD; Liquid Alternatives: Credit Suisse Hedge Fund USD; Global Credit: 50% Bloomberg High Yield Corporate TR USD + 50% Bloomberg EM Ex US Agg TR USD; Real Assets: Bloomberg Commodity TR
8: All figures reflect trailing twelve months. Investment return data is from Morningstar. Inflation data is from The Federal Reserve Bank of St. Louis. Monthly data spans from 1/1/1999-1/31/2024. Benchmarks used: US Equities: Russell 3000 TR USD; Int’l Equities: MSCI ACWI Ex USA GR USD; Core Fixed Income: Bloomberg US Agg Bond TR USD; Liquid Alternatives: Credit Suisse Hedge Fund USD; Global Credit: 50% Bloomberg High Yield Corporate TR USD + 50% Bloomberg EM Ex US Agg TR USD; Real Assets: Bloomberg Commodity TR
Disclosure
Orion Portfolio Solutions, LLC d/b/a Brinker Capital Investments (“OPS”) a registered investment advisor.
The views expressed herein are exclusively those of OPS, a registered Investment Advisor, and are not meant as investment advice and are subject to change. No part of this report may be reproduced in any manner without the express written permission of OPS. Information contained herein is derived from sources we believe to be reliable, however, we do not represent that this information is complete or accurate and it should not be relied upon as such. This information is prepared for general information only. It does not have regard to the specific investment objectives, financial situation, and the particular needs of any specific person. You should seek financial advice regarding the appropriateness of investing in any security or investment strategy discussed here and should understand that statements regarding future prospects may not be realized. You should note that security values may fluctuate, and that each security’s price or value may rise or fall. Accordingly, investors may receive back less than originally invested. Past performance is not a guide to future performance. Investing in any security involves certain systematic risks including, but not limited to, market risk, interest-rate risk, inflation risk, and event risk. These risks are in addition to any unsystematic risks associated with particular investment styles or strategies.
Glossary
Alpha: A measure of excess or abnormal returns beyond an asset’s benchmark after adjusting for risk.
Beta: A measure of volatility, or systematic risk of a security or a portfolio in comparison to the market as a whole. A beta of 1 indicates that the portfolio will likely move with the market. Anything less than 1 indicates that the security or the portfolio is typically less volatile than the market.
Tracking error: The difference between the performance of an asset and the performance of its benchmark. An asset with a low tracking error performs very similarly to its benchmark.
Société Générale Trend Index: An index used to track the performance of trend following based hedge fund managers.
0828-BCI-4/4/2024
