
“The investor’s chief problem—and his worst enemy—is likely to be himself. In the end, how your investments behave is much less important than how you behave.” – Benjamin Graham
The human mind is conditioned to simplify what is complicated. What caused your lawn to grow? Simple, a rainy spring. What caused you to lose weight? Simple, diet. What caused your child to fail their science exam? Simple, too many video games. In reality, the answers are usually more complicated than that. As we’ve learned all too well over the last year, the world is a complicated place, full of interconnecting and sometimes, contradictory relationships.
When we think about equities and what causes them to gain value, common answers are strong earnings or a good economy. Both are likely true. But in reality, there are literally dozens of influences simultaneously impacting portfolios, often in contradictory manners. Additionally, the dominant influence today may not be so tomorrow. It’s likely an oversimplification to say that I gained a few pounds exclusively because of my diet. In reality, it’s diet, exercise, water retention…etc., the list goes on and on. It’s also an oversimplification to assign one or a few cause-and-effect relationships to capital markets. Likely omitted from the top ten influences I suspect would be interest rates, although that concept has certainly gained popularity lately. The topic of this quarter’s Market Insight’s, The Trillion Dollar Staring Contest, is to examine why interest rates matter to stock and bond portfolios and, more importantly, discuss why this may continue to be of great importance to your portfolio and choice of assets going forward.
The Link Between Stocks, Bonds, and Rates
The connection between bonds and interest rates is hardly crystal clear, but less nebulous than the connection between stocks and interest rates. Simplistically, if I own a bond with a 5% coupon and an identical bond with a 2% coupon comes to market, which would be preferable, buying the 5% bond from me or taking the same risk and getting 2%? Naturally, you would prefer the 5% bond to the 2% bond and so would everyone else (all else being equal), making it more valuable (i.e., the price would appreciate). This simple example is commonly quantified in fixed income markets as duration, or the bond’s sensitivity to a change in interest rates. Typically, the longer the maturity, or the lower the yield, the greater the duration. Now, the wonky explanation…duration just simplifies the impact that changing discount rates have on a stream of cash flows, in this case a bond, into one easily interpreted number. This can be seen in the formula below.
While hardly obvious in the formula, the exponent in each term indicates that cash payments that are received later are more heavily discounted than those that occur sooner. That is, they are worth less today than near term cashflows. What would you prefer, $100 today or $100 ten years from now? Obviously $100 today. Think of this like the opposite of compound interest. Given this, bonds that return cash to the bondholder more quickly have a lower sensitivity to that discount rate, meaning if rates move up, you would prefer to own a 10-year coupon paying bond over a 10-year zero coupon bond. The coupon paying bond will decline by less with the upward move in interest rates, since it is paying you regular cashflows throughout the life of the bond.
Now, how does this pertain to stocks? Really through the same relationship. With stocks, like bonds, today’s value is just a discount of future cashflows. Let me make some substitutions.
Essentially, the formula is the same. Instead of discounting coupons for bonds we are discounting dividends for stocks. At maturity, a bond returns principal. While there is no specific maturity of a stock, we can assume a sales price. In the same manner that we calculate a present value for a bond, we can calculate it for a stock, or really anything with a future cashflow. Going back to the original question, how do interest rates impact stocks? Simple, through the discount rate. Lower rates equate to a higher present value (i.e., a higher current value of the stock), all else equal, just like higher rates result in a lower present value.
 Now that we understand the basic link between stocks and rates, there is one more concept worth mentioning. While we identified that coupon bonds are less sensitive to rates than zero coupon instruments, if we apply parallel logic to stocks, which stocks are likely to be less sensitive to rates? If you answered dividend paying stocks, in general you are correct. Dividend payers return capital to investors (i.e., regular dividend payments) sooner than non-dividend paying stocks. As with coupon bearing bonds, cashflows that are farther off in the future face steeper discounts than near-term cashflows. As rates rise, this disproportionately impacts non-dividend payers over dividend payers. The concept, much like with bonds, is called equity duration, but is really nothing more than the same discounted cashflow that we have been discussing.
What’s in Style?
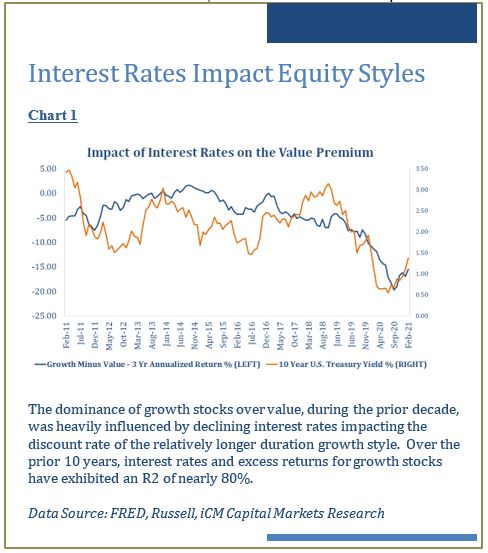
As we discussed a moment ago, stocks that return capital sooner, dividend payers, are less sensitive to changing rates than those that pay no dividends. This has important implications for portfolio construction with regard to style selection, growth vs. value. Over the past decade, growth has surprisingly outperformed value, the historical winner. It should come as no surprise then that a contributing factor was the declining interest rate environment over the last decade.
As we can see in Chart 1, declining rates have been a strong contributor to growth’s outperformance over value, explaining about 80% of the gap between the two styles over this period. The connection, of course, is that growth stocks tend to be lower dividend payers and the higher duration asset. In a declining rate environment,  they should be expected to have the wind at their back, much like a zero-coupon bond would in the same circumstance. It should also be expected then as rates rise, as they have over the past several months, that growth would struggle relative to its value counterpart.
Style isn’t the Only Implication
In the preceding paragraphs I explained the connection between stocks, bonds, and interest rates. But what are the practical implications of this right now, beyond style selection? As a valuation focused manager, it is no secret that we gnashed our teeth and spoke a few swear words as valuations marched increasingly to, and beyond, sustainable levels over the past several years. The argument by many market bulls was that low interest rates justified higher market valuations. But was this true? After all, valuations had marched to levels only seen previously during the peak of the internet bubble. Was this another bubble or had we missed something? In Chart 2 we demonstrate the relationship between interest rates and the P/E multiple. This model attempts to predict the current P/E multiple using both the level of interest rates and the slope of the yield curve, and does so with remarkable accuracy. Other than the internet bubble where valuations overran every valuation metric including those justified by interest rates, the link between valuations and interest rates is very strong. As we can see, current high valuations were not only explainable, but should be expected given the level of rates and the slope of the yield curve. So, to answer the first question, yes low rates were in fact responsible, at least in part, for an elevated valuation multiple. However, while high valuations could be explained with low interest rates (and a flat curve), it came with an important caveat. From those new elevated valuation levels, future returns should be expected to be lower, remarkably low in fact (Chart 3). So, while the valuation was propelled higher through the declining discount rate channel, it comes at the expense of future returns. Once again, the answer to a simple question is not exactly straight forward, but comes with caveats. Yes, declining rates can and do cause market multiples to elevate, but not without subtracting from tomorrow’s return in a true “rob Peter to pay Paul” moment.
How Does This Apply Today?
As I mentioned earlier, the argument being used by many market bulls, and even explained by our own model, is that low rates (and a flat curve) support a higher current P/E. What happens if rates move up? Simply put, the case for above-average valuations falls apart, but at what pace? That is, rates are very low, how much room do stocks have for error if rates move up some, but remained low by historical standards? It turns out probably not as much as you would think. At a 10-year treasury yield of 1.64%, the market has overrun its interest rate implied valuation by about 20%. If that yield were to become 1.80%, the S&P 500 would then be 32% overvalued using  the same argument that many market bulls had used to proclaim that all was well. Now, I must point out that the slope of the curve matters way more than the level of rates. So, if rates move up, investors should hope that they do so in uniform fashion. That would at least keep the “interest rates supporting high valuations” argument somewhat intact, as most other metrics are reaching extremes not seen since the internet bubble.
Thus far, we’ve learned that interest rates play an important role for stocks and bonds alike, through the discount rate channel, and that growth stocks are disproportionately damaged by rising rates when compared to value. Additionally, we have also learned that low rates and a flat curve cause P/E multiples to elevate, but come simultaneously at the expense of future returns. Finally, we identified that our current level of valuations is about 20% above what is supported by interest rates and that a small change in rates can disrupt this even further, if it comes in the form of curve steepening. That is, if long-term rates move up quicker than short-term rates. But one important question remains…how reasonable are further rate increases? As seen in Chart 4, the typical long-term relationship between breakeven inflation (i.e., expected inflation) and the 10-year treasury is that the 10-year bond typically provides a yield advantage of about 19bps per year above inflation. With inflation expected to be 2.3% over the next decade, this would imply a fair value yield of approximately 2.5%, with a range of 1.94%-3.04% for the 10-year bond, equating to an increase of .35% to 1.45% from where we are today. Given the previously discussed sensitivity to rate movements, suffice it to say, this could be a headwind for U.S. stocks, growth stocks in particular going forward.
The past several months have seen undervalued assets like emerging markets stocks and bonds, international stocks, commodities, and value stocks all resume leadership positions over their overvalued counterparts. Expensive assets have been the first to blink in what has amounted to nothing more than a Trillion Dollar Staring Contest. It’s been a refreshing change from the expensive just getting more expensive, but that’s what bubbles do. They tempt investors to do foolish things by telling feel good stories about spectacular visions and high growth rates that become so outrageous that they typically never come to pass, drawing the unsuspecting in along the way. All assets have a time and a place, including growth stocks. But there are no silver bullets that work always and forever. Valuations matter. Thank you, as always, for your trust and confidence.
1st Quarter 2021 Market Insights is intended solely to report on various investment views held by Integrated Capital Management, an institutional research and asset management firm, is distributed for informational and educational purposes only and is not intended to constitute legal, tax, accounting or investment advice. Opinions, estimates, forecasts, and statements of financial market trends that are based on current market conditions constitute our judgment and are subject to change without notice. Integrated Capital Management does not have any obligation to provide revised opinions in the event of changed circumstances. We believe the information provided here is reliable but should not be assumed to be accurate or complete. References to specific securities, asset classes and financial markets are for illustrative purposes only and do not constitute a solicitation, offer or recommendation to purchase or sell a security. Past performance is no guarantee of future results. All investment strategies and investments involve risk of loss and nothing within this report should be construed as a guarantee of any specific outcome or profit. Investors should make their own investment decisions based on their specific investment objectives and financial circumstances and are encouraged to seek professional advice before making any decisions. Index performance does not reflect the deduction of any fees and expenses, and if deducted, performance would be reduced. Indexes are unmanaged and investors are not able to invest directly into any index. The S&P 500 Index is a market index generally considered representative of the stock market as a whole. The index focuses on the large-cap segment of the U.S. equities market.
