
By Chris Konstantinos, CFA
SUMMARY
- In ’24 we don’t believe the bull market in stocks will end.
- Market positives: An easier Fed and solid corporate earnings.
- Headwinds: Higher starting valuations and election uncertainties.
2024 to be a Volatile but Ultimately Profitable Exercise for Investors, in Our View
RiverFront is proud to release our 2024 Outlook, entitled ‘Tap-Dancing on a Tightrope’. Our Outlook is a visual chart pack designed to walk investors through our investment views and predictions for the upcoming year. In today’s Weekly View, we created a concise synopsis of the Outlook’s conclusions, along with a few selected visuals that encapsulate a number of key takeaways.
Next 12 Months Outlook: ‘Tap-Dancing on a Tightrope’ Ultimately a Profitable Exercise for Investors
- We don’t believe the bull market in stocks is over…but we expect lower returns from here due to valuation (see scenario forecast table, below).
- Recession risk in 2024 is under 50%, in our view: We believe the US economy is much stronger than international economies.
- Market positives as we look into ‘24 include a Fed that is at the end of hiking cycle, and solid potential for corporate earnings growth.
- Headwinds for the market include stock valuation relative to interest rates and uncertainties ahead of the US Presidential election.
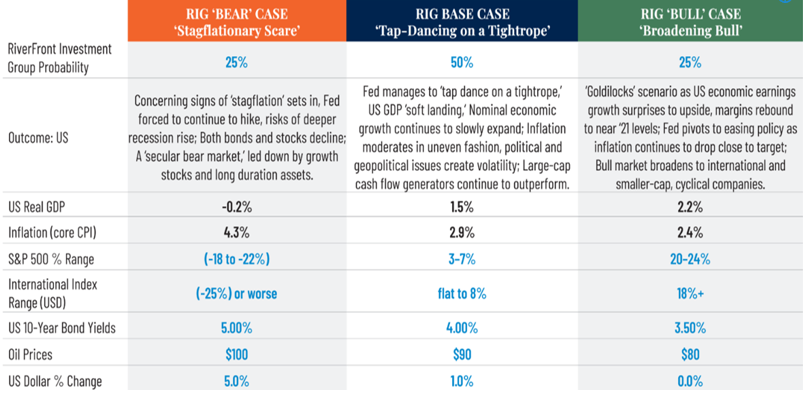
The table to the left depicts RiverFront’s predictions for 2024 using three scenarios (Pessimistic (Bear), Base, and Optimistic (Bull)). Our assessment of each scenario’s probability (“RiverFront Investment Group Probability”) is also shown. The assessment is based on RiverFront’s Investment team’s views and opinions as of 12.15.2023. Each case is hypothetical and is not based on actual investor experience. Yield and return estimates listed are for general asset classes and not related or reflective of any RiverFront portfolio investment. These views are subject to change and are not intended as investment recommendations. There is no representation that an investor will or is likely to achieve positive returns, avoid losses or experience returns as discussed for various market classes. See Definitions & Disclosures section for index definitions.
Modest Upside for Stocks & Bonds in ‘Base Case’ Scenario
We place a 50% probability on our ‘Base Case’ scenario playing out next year – twice as high a probability as either our Bull or Bear cases. In our Base Case, stocks have a positive year due to growing corporate earnings (Chart 1, below), but upside is capped in the single-digit range by stock valuations that are close to a ceiling, in our view, especially relative to fixed income alternatives (Chart 2, below). Sticking true to a typical presidential election year, we expect the 1st half of the year to be range bound and volatile, before finishing 2024 strong (Chart 3, below). Multi-year bond price weakness sets up attractive risk-adjusted returns for fixed income & balanced portfolios, in our view (Chart 4, below).
The Conference Board’s Leading Economic Indicator index (LEI) has historically been highly correlated with inflection points in US stocks’ corporate earnings per share about 3 months later, in our view.
The recent upturn in the LEI (green line in chart to the right) suggests to us that S&P 500 Earnings Per Share (blue line in the chart to the right) are stabilizing, and possibly even improving.
Chart 1: S&P 500 Corporate Earnings Look Solid for 2024, in Our View; Uptrend Has Resumed
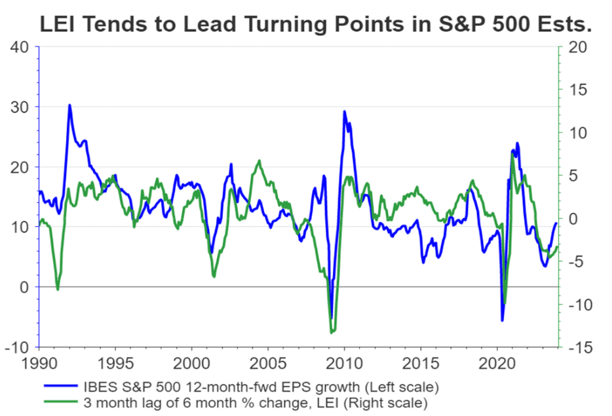
Source: LSEG Datastream, RiverFront; data monthly as of 12.06.2023. Chart right shown for illustrative purposes only. Past performance is no guarantee of future performance. See Definitions & Disclosures section for index definitions.
Higher yields on government bonds are providing balanced investors a choice again.
While the earnings yield on the S&P 500 is no longer a lot more attractive than bond yields, we still believe stocks are reasonably valued if earnings can continue to grow.
Chart 2: Stocks Can Grow from Here with Earnings, but Valuations Relative to Rates Caps Upside
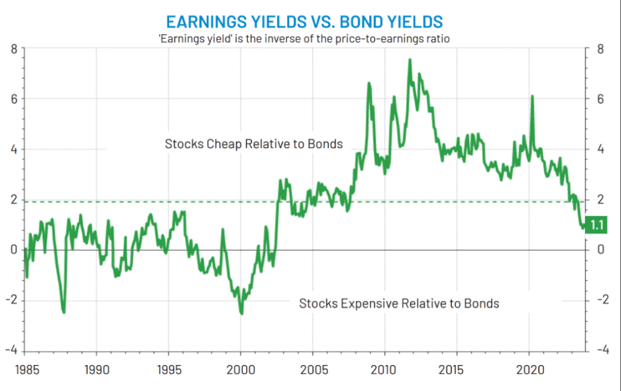
Source: LSEG Datastream, RiverFront; data daily as of 12.01.2023. Past results are no guarantee of future results and no representation is made that a client will or is likely to achieve positive returns, avoid losses, or experience returns similar to those shown or experienced in the past. Chart right shown for illustrative purposes only. In a rising interest rate environment, the value of fixed income securities generally declines. Past performance is no indication of future results. See Definitions & Disclosures section for S&P 500 index definition.
The chart at the top of the next page, courtesy of NDR Research, follows the trend in the Dow Jones Industrials over a four-year presidential cycle from 1900-2022. One historical pattern that emerges is ‘pre-election jitters’: following a strong first half of the 3rd year of a Presidency, the last quarter of that year and the first half of the election year tend to be volatile and range-bound (red box on chart below).
Encouragingly, there has also been a significant upward trend in the second half of an election year, as markets crave the certainty that election results bring (green box on chart below). We expect 2024 to be similar to history in this regard.
Chart 3: Election Cycle Suggests To Us Volatility into Second Half of the Year
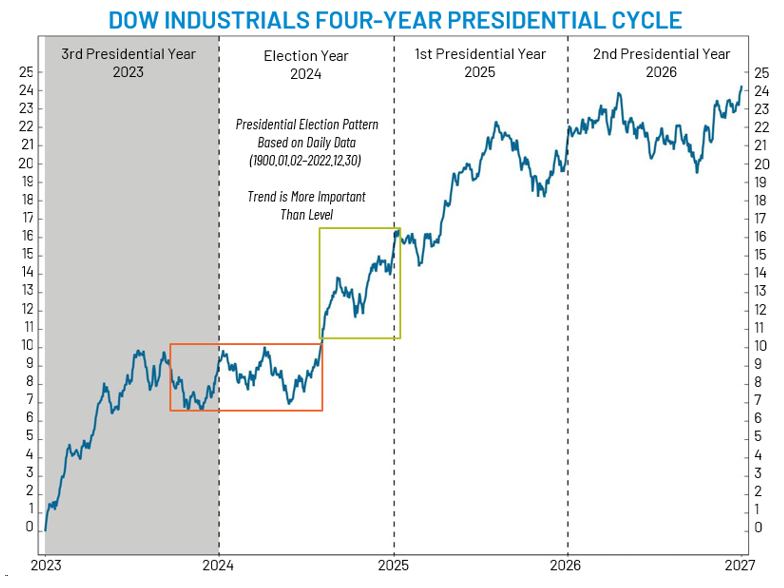
Source: Ned Davis Research. Chart S01642. ©2023 Ned Davis Research Inc. Further distribution prohibited without prior permission. All Rights Reserved. See NDR Disclaimer at ndr.com/copyright.html. For data disclaimers, refer to ndr.com/vendorinfo/. Source: Federal Reserve Economic Data. Data as of 03.31.23. Chart shown for illustrative purposes only. This chart follows the trend in the Dow Jones Industrials over a four-year presidential cycle based on daily data starting in the year 1900. In this graph, the trend is more important than the actual level of the Dow. The chart shows that there has historically been a significant upward trend in the second half of an election year and the first half of the third year in a President’s term. Past results are no guarantee of future results and no representation is made that a client will or is likely to achieve positive returns, avoid losses, or experience returns similar to those shown or experienced in the past. Performance shown is not representative of any RiverFront portfolio or client experience. The Dow Jones Industrial Average (DJIA) is a stock market index that tracks 30 large, publicly-owned blue-chip companies trading on the New York Stock Exchange (NYSE) and Nasdaq.
At current yields, we like bonds, especially on a risk-adjusted basis. Yields are now outpacing inflation, offering investors positive real returns again.
The period from 2021-2023 (year-to-date, through 10.31.2023) represents one of the worst government bond markets in history (see yellow bars on chart, right). However, we expect bond returns to improve going forward.
Analyzing the worst decile of 30-year Treasury returns from 1942-2020 (table & red bars on chart, right) shows the subsequent 5-year cumulative forward returns from those starting points have been positive. We expect history to repeat itself here.
Chart 4: Bonds: Poised to be the Comeback Kid, in Our View
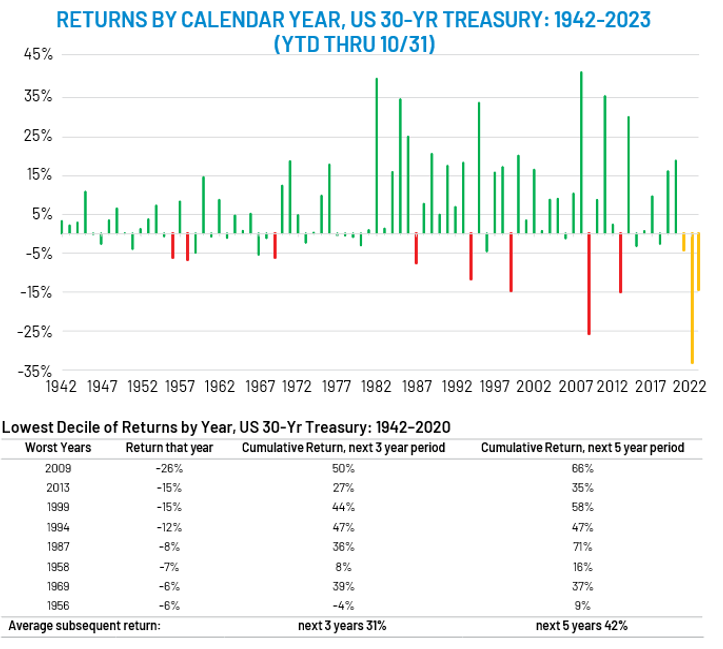
Source: Bianco Research, data courtesy of Edward F. McQuarrie, RiverFront; data annually, updated as of 10.31.2023. Chart right shown for illustrative purposes. Past results are no guarantee of future results, and no representation is made that a client will or is likely to achieve positive returns, avoid losses, or experience returns similar to those shown or experienced in the past. Shown for illustrative purposes only. In a rising interest rate environment, the value of fixed income securities generally declines. Performance shown is not representative of any RiverFront portfolio or client experience.
Portfolio Views and Positioning: Continue to Focus on Consistent Cash Flow and Dividends/Coupons
In our Base Case, we expect the following selection themes to play out:
- Prefer US stocks to International: We favor the US over international, given geographic and demographic advantages, stronger margins;
- Within the US, we favor consistent cash flow generators in areas like technology and energy
- International Equities: Still waiting for proof of sustainable earnings rebound
- Developed Markets: European, Asian economies weaker than US; Focus on ‘wide-moat’ business models
- Emerging Markets: Underweight – Remain skeptical on China economy
- Fixed Income: Fed easing, will look to opportunistically add
Risk Discussion: All investments in securities, including the strategies discussed above, include a risk of loss of principal (invested amount) and any profits that have not been realized. Markets fluctuate substantially over time, and have experienced increased volatility in recent years due to global and domestic economic events. Performance of any investment is not guaranteed. In a rising interest rate environment, the value of fixed-income securities generally declines. Diversification does not guarantee a profit or protect against a loss. Investments in international and emerging markets securities include exposure to risks such as currency fluctuations, foreign taxes and regulations, and the potential for illiquid markets and political instability. Please see the end of this publication for more disclosures.
Important Disclosure Information:
The comments above refer generally to financial markets and not RiverFront portfolios or any related performance. Opinions expressed are current as of the date shown and are subject to change. Past performance is not indicative of future results and diversification does not ensure a profit or protect against loss. All investments carry some level of risk, including loss of principal. An investment cannot be made directly in an index.
Information or data shown or used in this material was received from sources believed to be reliable, but accuracy is not guaranteed.
This report does not provide recipients with information or advice that is sufficient on which to base an investment decision. This report does not take into account the specific investment objectives, financial situation or need of any particular client and may not be suitable for all types of investors. Recipients should consider the contents of this report as a single factor in making an investment decision. Additional fundamental and other analyses would be required to make an investment decision about any individual security identified in this report.
Chartered Financial Analyst is a professional designation given by the CFA Institute (formerly AIMR) that measures the competence and integrity of financial analysts. Candidates are required to pass three levels of exams covering areas such as accounting, economics, ethics, money management and security analysis. Four years of investment/financial career experience are required before one can become a CFA charterholder. Enrollees in the program must hold a bachelor’s degree.
All charts shown for illustrative purposes only. Technical analysis is based on the study of historical price movements and past trend patterns. There are no assurances that movements or trends can or will be duplicated in the future.
Stocks represent partial ownership of a corporation. If the corporation does well, its value increases, and investors share in the appreciation. However, if it goes bankrupt, or performs poorly, investors can lose their entire initial investment (i.e., the stock price can go to zero). Bonds represent a loan made by an investor to a corporation or government. As such, the investor gets a guaranteed interest rate for a specific period of time and expects to get their original investment back at the end of that time period, along with the interest earned. Investment risk is repayment of the principal (amount invested). In the event of a bankruptcy or other corporate disruption, bonds are senior to stocks. Investors should be aware of these differences prior to investing.
In general, the bond market is volatile, and fixed income securities carry interest rate risk. (As interest rates rise, bond prices usually fall, and vice versa). This effect is usually more pronounced for longer-term securities). Fixed income securities also carry inflation risk, liquidity risk, call risk and credit and default risks for both issuers and counterparties. Lower-quality fixed income securities involve greater risk of default or price changes due to potential changes in the credit quality of the issuer. Foreign investments involve greater risks than U.S. investments, and can decline significantly in response to adverse issuer, political, regulatory, market, and economic risks. Any fixed-income security sold or redeemed prior to maturity may be subject to loss.
Investments in international and emerging markets securities include exposure to risks such as currency fluctuations, foreign taxes and regulations, and the potential for illiquid markets and political instability.
Index Definitions:
Standard & Poor’s (S&P) 500 Index (US Large Cap) measures the performance of 500 large cap stocks, which together represent about 80% of the total US equities market.
Gross Domestic Product (GDP) is the monetary value of all finished goods and services made within a country during a specific period. GDP provides an economic snapshot of a country, used to estimate the size of an economy and growth rate.
The Consumer Price Index (CPI) is a measure that examines the weighted average of prices of a basket of consumer goods and services, such as transportation, food, and medical care. It is calculated by taking price changes for each item in the predetermined basket of goods and averaging them. Changes in the CPI are used to assess price changes associated with the cost of living. The CPI is one of the most frequently used statistics for identifying periods of inflation or deflation.
Principal Risks:
In a rising interest rate environment, the value of fixed income securities generally declines.
Definitions:
Stagflation is the persistent high inflation combined with high unemployment and stagnant demand in a country’s economy.
The Composite Index of Leading Indicators, otherwise known as the Leading Economic Index (LEI), is an index published monthly by The Conference Board. It is used to predict the direction of global economic movements in future months. The index is composed of 10 economic components whose changes tend to precede changes in the overall economy. Businesses and investors can use the index to help plan their activities around the expected performance of the economy and protect themselves from economic downturns.
RiverFront Investment Group, LLC (“RiverFront”), is a registered investment adviser with the Securities and Exchange Commission. Registration as an investment adviser does not imply any level of skill or expertise. Any discussion of specific securities is provided for informational purposes only and should not be deemed as investment advice or a recommendation to buy or sell any individual security mentioned. RiverFront is affiliated with Robert W. Baird & Co. Incorporated (“Baird”), member FINRA/SIPC, from its minority ownership interest in RiverFront. RiverFront is owned primarily by its employees through RiverFront Investment Holding Group, LLC, the holding company for RiverFront. Baird Financial Corporation (BFC) is a minority owner of RiverFront Investment Holding Group, LLC and therefore an indirect owner of RiverFront. BFC is the parent company of Robert W. Baird & Co. Incorporated, a registered broker/dealer and investment adviser.
To review other risks and more information about RiverFront, please visit the website at www.riverfrontig.com and the Form ADV, Part 2A. Copyright ©2023 RiverFront Investment Group. All Rights Reserved. ID 3288637
For more news, information, and analysis, visit the ETF Strategist Channel.
