By the Riverfront Writing Team:
-
Rebecca Felton, Senior Market Strategist
-
Adam Grossman, CFA, Global Equity CIO | Co-Head of Investment Committee
-
Chris Konstantinos, CFA, Director of Investments | Chief Investment Strategist
-
Kevin Nicholson, CFA, Global Fixed Income Co-CIO | Co-Head of Investment Committee
-
Doug Sandler, CFA, Head of Global Strategy
- Rod Smyth, Chairman of the Board of Directors
STOCKS OFFER BETTER REWARD-TO-RISK VERSUS BONDS…BUT LIKELY TO BE A BUMPY RIDE
SUMMARY
- In our Base Case, we believe US stocks generate positive returns in ‘22 but with more volatility.
- We start the year overweight US equities and underweight fixed income.
- The largest market risk we see is interest rates rising faster than we forecast.
Riverfront is proud to release our 2022 Outlook, entitled ‘Riding the Recovery’. Our Outlook is a visual chart pack designed to walk investors through our investment views and predictions for the upcoming year. In today’s Weekly View, we created a concise synopsis of the Outlook’s conclusions, along with four selected visuals that encapsulate a number of key takeaways. NOTE: Investors should contact your financial advisor to request a copy of the Outlook 2022.
We liken stock investing in 2022 to the experience of riding a mechanical bull; more controlled than it seems, and ultimately rewarding… but not without its share of white-knuckle moments. In our Base Case scenario (see table below), we foresee 2022 as another bull market for stocks, but caution investors that overall returns for stocks are likely to be lower than in the last 12 months, and volatility likely to be higher. We start the year overweight US equities and underweight fixed income. We also see some selected opportunities overseas, preferring developed markets to emerging ones. While we are bullish on stocks, we recognize that interest rates rising faster and higher than we foresee are perhaps the biggest risks facing the market.
|
RiverFront Investment Group Probability |
PESSIMISTIC (BEAR CASE) ‘Echoes of Stagflation’ |
BASE CASE |
OPTIMISTIC (BULL CASE) ‘Goldilocks’ |
|
25% |
55% |
20% |
|
|
Outcome (US) |
Persistent high core inflation forces the Fed’s hand into at least 3 rate hikes in 2022; Concerning signs of ‘stagflation’ sets in, as US GDP growth sags even as inflation rises; Both bonds and stocks suffer |
US GDP continues to expand commensurate with a typical mid-cycle economic rebound; Inflation moderates as employment and supply chain normalizes; COVID-19 lingers, but no complete shutdowns; Fed remains dovish; Corporate tax raised to 25% |
US economy roars back from COVID-19 recession as pent-up consumer demand strong and anti-viral drugs show efficacy; Inflation moderates; Political gridlock offers ‘goldilocks’ (no tax hikes, bipartisan infrastructure stimulus, easier trade) |
|
US GDP |
3%, With Negative Surprise in H2 |
4.2% |
4.7% |
|
Inflation (CPI) |
5.0% |
3.5% |
2.5% |
|
S&P 500 % Range |
-15% or Worse |
6-8% |
16-20% |
|
International Index Range (USD) |
-17% or Worse |
4-6%; Developed Markets Outperform Emerging Markets |
25%+ |
|
US 10-Year Bond Yields |
2.0-2.5% |
2.0% |
1.50-2.0% |
|
Oil Prices |
$90 |
$72 |
$68 |
|
US Dollar % Change |
-4.0% |
1.0% |
3.0% |
Please see Important Disclosure Information section for definitions and disclosures.
2022 CATALYSTS, RISKS AND KEY DRIVERS: “The I’s Have It’
Positive catalysts we see for 2022 include solid earnings growth, relatively low interest rates, and capital shifting from bond to stock allocations. The biggest risk we see for stocks is not another pandemic-led economic shutdown, but rather interest rates rising faster than we are expecting, placing downward pressure on stock market valuations.
Key drivers we are watching closely include inflation expectations, interest rates, and the continued innovation within the US economy and corporate sector. In addition, the way that interest rates historically interact with stock market valuation informs our view of the intrinsic value of equities. We call these key drivers the ‘Four I’s‘ and view them as worthy of more in-depth analysis; each has its own section in our Outlook.
INTRINSIC VALUE: Stocks Are Pricey Relative to History, But Reasonable Relative to Rates
While stocks are expensive relative to history, we think they remain reasonably valued relative to interest rates. The difference between the expected earnings yield on the S&P 500 on 12 month-forward earnings and the yield on the 10-year Treasury Note— the equity risk premium — is +3.2 percentage points as of quarter-end (green line).
Dividend yields are also slightly greater than treasury yields (blue line), suggesting equities provide attractive income potential over ‘risk- free’ alternatives.
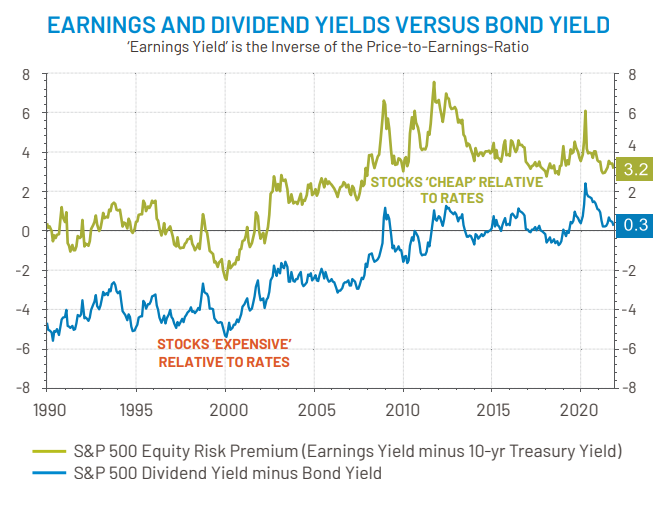
Source: Refinitiv Datastream, RiverFront, data weekly, as of 12.06.2021. Chart shown for illustrative purposes only. Past performance is no guarantee of future results. See disclosures for definitions.
These lines are high relative to history, suggesting to us that stocks are still reasonably valued — particularly compared to the peak- market times of the late 1990s or mid-2000s.
INNOVATION: Technological Productivity Continues to Power US Economy and Corporate Earnings
As measured by Gross Domestic Product (GDP), the US economy has eclipsed its pre-pandemic high output. Even more impressively, US corporate profits are now 37% above its pre-pandemic high.
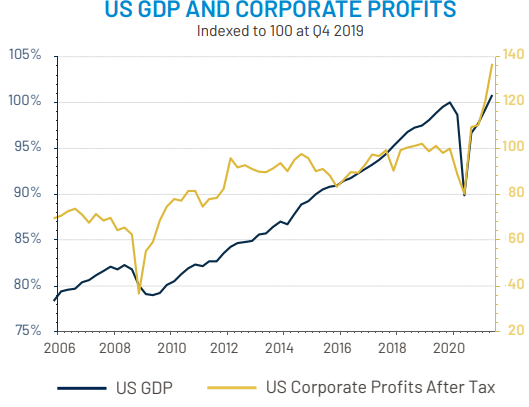
Source: Refinitiv Datastream, Fathom Consulting; data quarterly, last data release Q2 2021. Chart shown for illustrative purposes only. See disclosures for definitions.
In contrast, other similar developed world economies such as the Eurozone and Japan have yet to reach their pre-pandemic heights in economic output.
INFLATION: A Little Bit of Inflation May Be Good for Stocks
There is concern about inflation’s potential to damage stocks by hurting corporate margins and thus earnings per share (EPS) growth. However, there is some evidence to suggest that higher consumer inflation corresponds to stronger corporate earnings, not weaker. Our own internal research suggests that changes in CPI actually have a strong positive correlation to changes in US large-cap stock earnings.
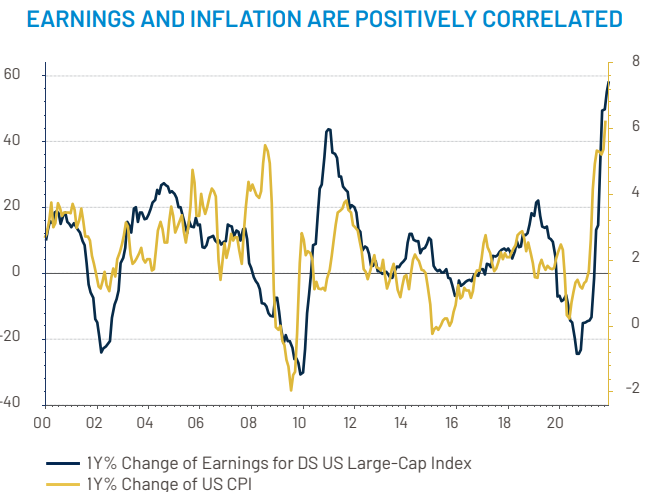
Source: Refinitiv Datastream, Fathom Consulting; data weekly, as of 12.06.21. Chart shown for illustrative purposes only. The US-DS Market is the Thomson Reuters Global Equity Indices. See disclosures for definitions.
As long as inflation is a result of strong economic growth – as is the case currently – we think stocks can shake off mildly higher inflation.
INTEREST RATES: Stock Market Can Endure Initial Rate Hikes
The Fed is likely to begin to hike interest rates at some point in 2022. According to a study by Ned Davis Research, across the last sixteen rate hike cycles starting in 1946, US stock gains have averaged +5.1% and +4.3% respectively in the first and second years of a Fed rate tightening cycle.
More recent results have been better. Over the last thirty years, the market has averaged +12.8% in the year after the first rate hike (see red dots on chart). Stocks can produce positive returns during hike cycles, as long as rates are rising due to economic growth…and that rate increases are gradual.
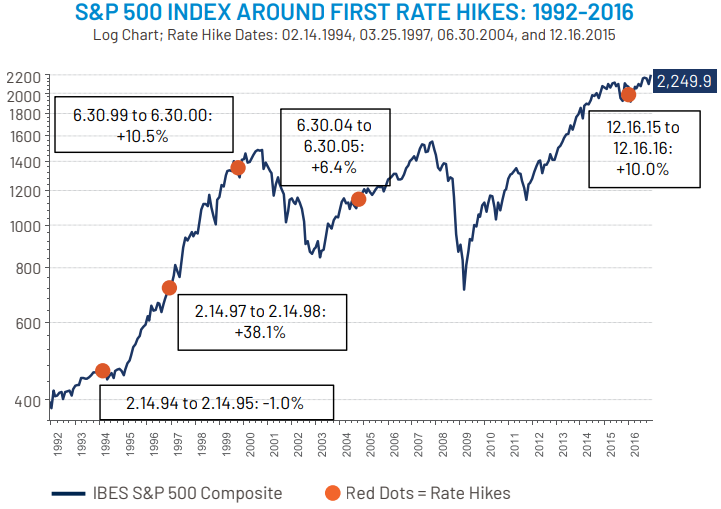
Source: Refinitiv Datastream, RiverFront; data monthly, as of 12.30.2016. Past Performance is no guarantee of future results Shown for illustrative purposes and not reflective of RiverFront portfolio performance. See disclosures for definitions.
Originally published by Riverfront on December 20, 2021.
For more news, information, and strategy, visit the ETF Strategist Channel.
Important Disclosure Information
The comments above refer generally to financial markets and not RiverFront portfolios or any related performance. Opinions expressed are current as of the date shown and are subject to change. Past performance is not indicative of future results and diversification does not ensure a profit or protect against loss. All investments carry some level of risk, including loss of principal. An investment cannot be made directly in an index.
Chartered Financial Analyst is a professional designation given by the CFA Institute (formerly AIMR) that measures the competence and integrity of financial analysts. Candidates are required to pass three levels of exams covering areas such as accounting, economics, ethics, money management and security analysis. Four years of investment/financial career experience are required before one can become a CFA charterholder. Enrollees in the program must hold a bachelor’s degree.
Information or data shown or used in this material was received from sources believed to be reliable, but accuracy is not guaranteed.
This report does not provide recipients with information or advice that is sufficient on which to base an investment decision. This report does not take into account the specific investment objectives, financial situation or need of any particular client and may not be suitable for all types of investors. Recipients should consider the contents of this report as a single factor in making an investment decision. Additional fundamental and other analyses would be required to make an investment decision about any individual security identified in this report.
The table on page 1 reflects RiverFront’s predictions for 2022 using three scenarios (Pessimistic (Bear), Base, and Optimistic (Bull)). Our assessment of each scenario’s probability (“RiverFront Investment Group Probability”) is also shown. The assessment is based on RiverFront’s Investment team’s views and opinions as of 12.06.2021.
Each case is hypothetical and is not based on actual investor experience. These views are subject to change and are not intended as investment recommendations.
There is no representation that an investor will or is likely to achieve positive returns, avoid losses or experience returns as discussed for various market classes.
Gross Domestic Product (GDP) is the monetary value of all finished goods and services made within a country during a specific period. GDP provides an economic snapshot of a country, used to estimate the size of an economy and growth rate.
The Consumer Price Index (CPI) is a measure that examines the weighted average of prices of a basket of consumer goods and services, such as transportation, food, and medical care. It is calculated by taking price changes for each item in the predetermined basket of goods and averaging them. Changes in the CPI are used to assess price changes associated with the cost of living. The CPI is one of the most frequently used statistics for identifying periods of inflation or deflation.
H2 = Second half of calendar year. Stagflation is the persistent high inflation combined with high unemployment and stagnant demand in a country’s economy.
The Institutional Brokers’ Estimate System (IBES) is a database used by brokers and active investors to access the estimates made by stock analysts regarding the future earnings of publicly traded American companies.
When referring to being “overweight” or “underweight” relative to a market or asset class, RiverFront is referring to our current portfolios’ weightings compared to the composite benchmarks for each portfolio. Asset class weighting discussion refers to our Advantage portfolios. For more information on our other portfolios, please visit www.riverfrontig.com or contact your Financial Advisor.
Technology and internet-related stocks, especially of smaller, less-seasoned companies, tend to be more volatile than the overall market.
Investing in foreign companies poses additional risks since political and economic events unique to a country or region may affect those markets and their issuers. In addition to such general international risks, the portfolio may also be exposed to currency fluctuation risks and emerging markets risks as described further below.
Changes in the value of foreign currencies compared to the U.S. dollar may affect (positively or negatively) the value of the portfolio’s investments. Such currency movements may occur separately from, and/or in response to, events that do not otherwise affect the value of the security in the issuer’s home country. Also, the value of the portfolio may be influenced by currency exchange control regulations. The currencies of emerging market countries may experience significant declines against the U.S. dollar, and devaluation may occur subsequent to investments in these currencies by the portfolio.
Foreign investments, especially investments in emerging markets, can be riskier and more volatile than investments in the U.S. and are considered speculative and subject to heightened risks in addition to the general risks of investing in non-U.S. securities. Also, inflation and rapid fluctuations in inflation rates have had, and may continue to have, negative effects on the economies and securities markets of certain emerging market countries.
Stocks represent partial ownership of a corporation. If the corporation does well, its value increases, and investors share in the appreciation. However, if it goes bankrupt, or performs poorly, investors can lose their entire initial investment (i.e., the stock price can go to zero). Bonds represent a loan made by an investor to a corporation or government. As such, the investor gets a guaranteed interest rate for a specific period of time and expects to get their original investment back at the end of that time period, along with the interest earned. Investment risk is repayment of the principal (amount invested). In the event of a bankruptcy or other corporate disruption, bonds are senior to stocks. Investors should be aware of these differences prior to investing.
‘Risk-Free’ rate is the theoretical rate of return of an investment with zero risk, which we define by using the 10-yr US Treasury Yield.
Price-Earnings Ratio (P/E Ratio) is the ratio for valuing a company that measures its current share price relative to its per-share earnings.
Earnings per share (EPS) is calculated as a company’s profit divided by the outstanding shares of its common stock. The resulting number serves as an indicator of a company’s profitability. The Consumer Price Index (CPI) is a measure of the average change over time in the prices paid by urban consumers for a market basket of consumer goods and services.
Index Definitions:
Thomson Reuters Global Equity Indices cover 51 countries and 29 regions. The indices are free float adjusted; market capitalization weighted and are designed to serve as broad market benchmarks to track the performance of liquid equities worldwide.
MSCI EAFE Index NR USD (Developed International Equities) is designed to represent the performance of large and mid-cap securities across 21 developed markets, including countries in Europe, Australasia and the Far East, excluding the US and Canada. Net total return indices reinvest dividends after the deduction of withholding taxes, using (for international indices)
a tax rate applicable to nonresident institutional investors who do not benefit from double- taxation treaties.
MSCI Emerging Markets Index NR USD (Emerging Market Equities) is an equity index that captures large and midcap representation across 27 emerging markets (EM) countries.
Standard & Poor’s (S&P) 500 Index TR USD (Large Cap) measures the performance of 500 large cap stocks, which together represent about 80% of the total US equities market.
RiverFront Investment Group, LLC (“RiverFront”), is a registered investment adviser with the Securities and Exchange Commission. Registration as an investment adviser does not imply any level of skill or expertise. Any discussion of specific securities is provided for informational purposes only and should not be deemed as investment advice or a recommendation to buy or sell any individual security mentioned. RiverFront is affiliated with Robert W. Baird & Co. Incorporated (“Baird”), member FINRA/SIPC, from its minority ownership interest in RiverFront. RiverFront is owned primarily by its employees through RiverFront Investment Holding Group, LLC, the holding company for RiverFront. Baird Financial Corporation (BFC) is a minority owner of RiverFront Investment Holding Group, LLC and therefore an indirect owner of RiverFront. BFC is the parent company of Robert W. Baird & Co. Incorporated, a registered broker/dealer and investment adviser.
To review other risks and more information about RiverFront, please visit the website at www.riverfrontig.com and the Form ADV, Part 2A. Copyright ©2021 RiverFront Investment Group. All Rights Reserved. ID 1964578
