
By Confluence Asset Management
The dollar is in its third major bull market since currencies began floating in 1971.
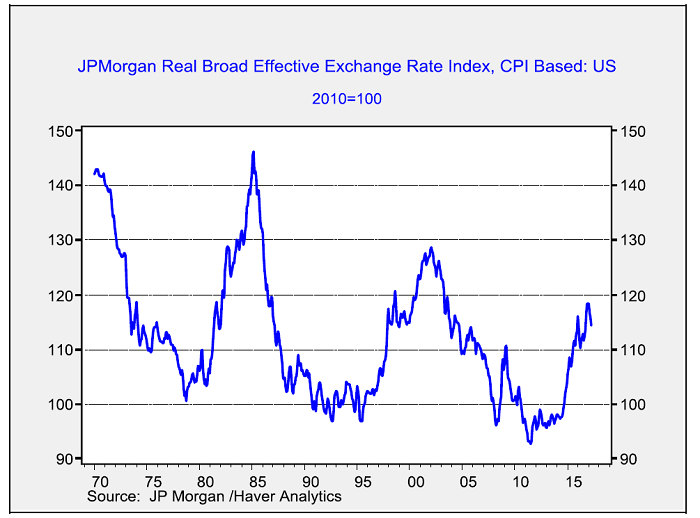
This chart shows the JPM dollar index which adjusts for relative inflation and trade. The previous two bull markets exhibited greater strength than the current one. Because of the dollar’s reserve currency role, there will always be an underlying demand for dollars for foreign reserve purposes. Thus, U.S. policymakers can run fiscal deficits and tax policies that penalize saving (for example, we tax income instead of consumption) and not suffer from foreign exchange crises. At the same time, dollar strength can act as a drag on the economy; it tends to make imports more attractive and can undermine the competitiveness of domestic firms.
The previous two dollar rallies were tied to specific fundamental factors. The 1978-85 bull market was mostly attributable to the Volcker Federal Reserve. Paul Volcker instituted monetary policy based on money supply growth instead of interest rate targets. This allowed interest rates to rise to extraordinary levels (fed funds peaked at 19.1% in June 1981) and made the dollar very attractive. The 1995-2002 bull market was mostly caused by productivity gains, although fiscal surpluses likely contributed as well. Technology investment began to boost the economy in the latter half of the 1990s and made the U.S. an attractive investment venue.
The surplus reduced available Treasuries and made it difficult to build reserves without bidding the dollar higher. The current bull market is similar to the Volcker bull market in that it appears to be mostly due to monetary policy. The Federal Reserve began to reverse its unconventional monetary policy measures before the other major G-7 economies, boosting the greenback.
Valuing currencies is difficult as it is generally true that the currency markets focus on different factors over time. There are periods when relative inflation is dominant. During other periods, the external accounts drive the exchange rates, while other times interest rate differentials are key.
The valuation model with the longest history is purchasing power parity, which is based on relative inflation rates. The thesis is that the exchange rate should act to balance prices between nations and so a country with higher inflation relative to another should have a weaker exchange rate to unify prices across countries.
In practice, we find that not all goods are tradeable, inflation indices are not the same across countries and relative pricing parity models don’t account for capital flows. Although parity models often deviate from fair value, they can be useful when parity reaches an extreme.
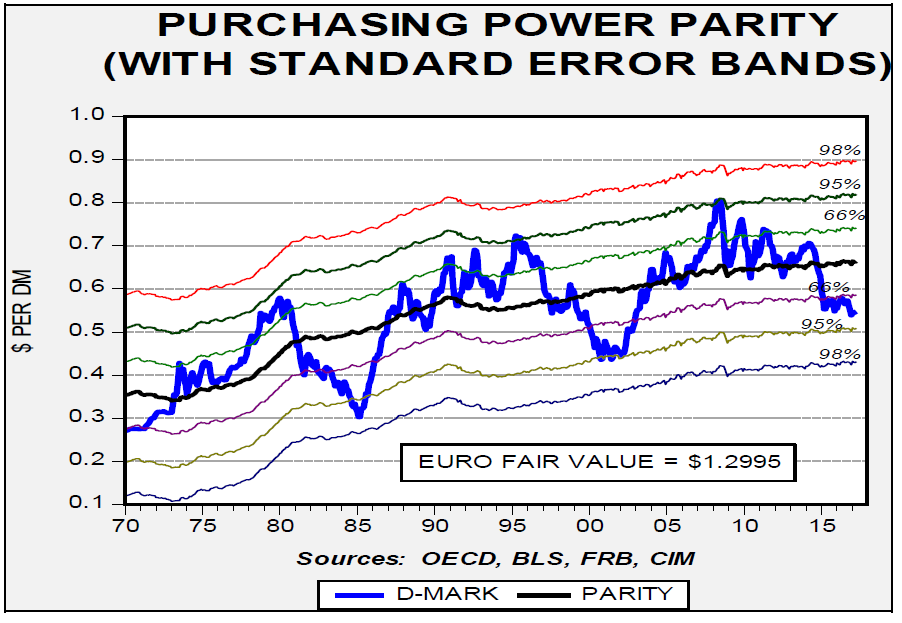
This chart shows the German/U.S. parity model, which uses CPI from Germany and the U.S. to establish parity. Currently, the exchange rate is nearly two standard errors below parity, meaning the D-mark (or the euro) is undervalued relative to the dollar. As the chart shows, the exchange rate rarely stays around purchasing power parity. However, when it reaches the two standard error level in either direction, it usually means the exchange rate will eventually reverse.
