
Where
is the long-term average of monthly differences in betas for the Hi and Lo legs. By using the long-term average difference, we can capture the long-term beta exposure without incorporating timing effects of changing relative beta levels.
To test whether factors benefit from beta timing, we will calculate a portfolio whose monthly excess return is:
This return represents the difference between each month’s actual beta spread versus the long-term average. Deviation from this average captures the “timing” component of changes in the beta spreads.
We will also calculate a portfolio that captures the residual effects: the difference between the traditional factor portfolio returns and the returns accounted for by the average beta exposure and timing exposure. The residual return is essentially the beta-neutral factor exposure.
![]()
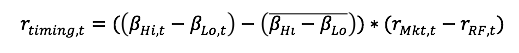
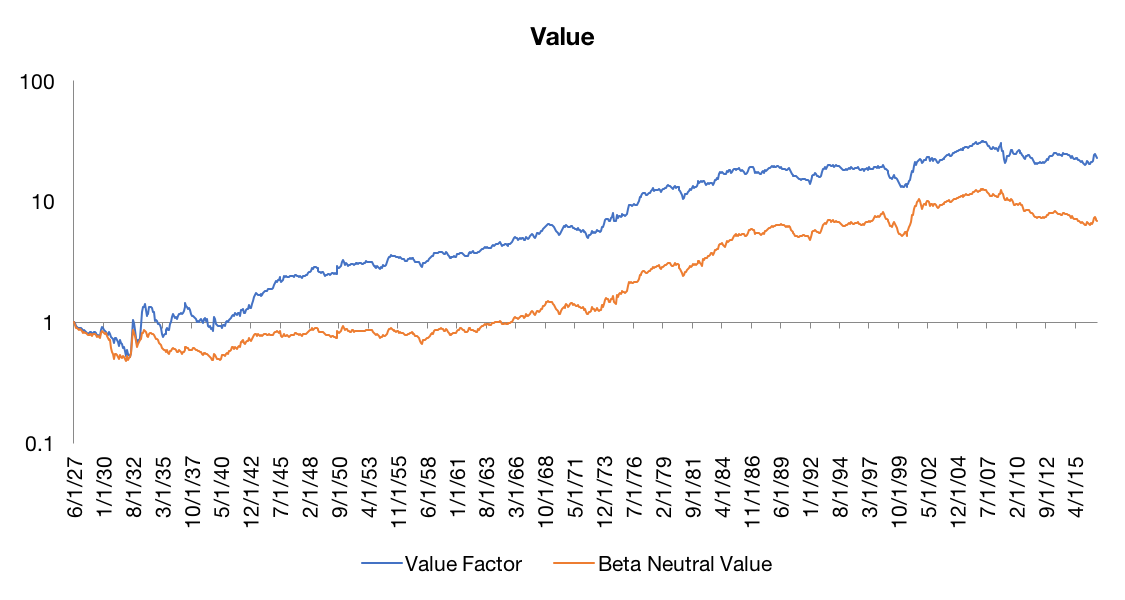
The Value Factor
Source: Kenneth French Data Library. Calculations by Newfound Research.
- On average, the value factor has had a positive beta. This long market exposure added about 0.48% per year to performance. We can think of this as overlapping exposure with the equity risk premium, and not actually due to the value factor itself.
- Beta timing added 1.23% per year. We can see that it was largely additive in the first 30 years, and then was a drag over the next 60. In fact, based on this data we could argue that the returns in the first 30 years of the value factor are due almost entirely to beta timing.
- The residual, or beta neutral portion of the factor, accounted for about 1.79% per year.
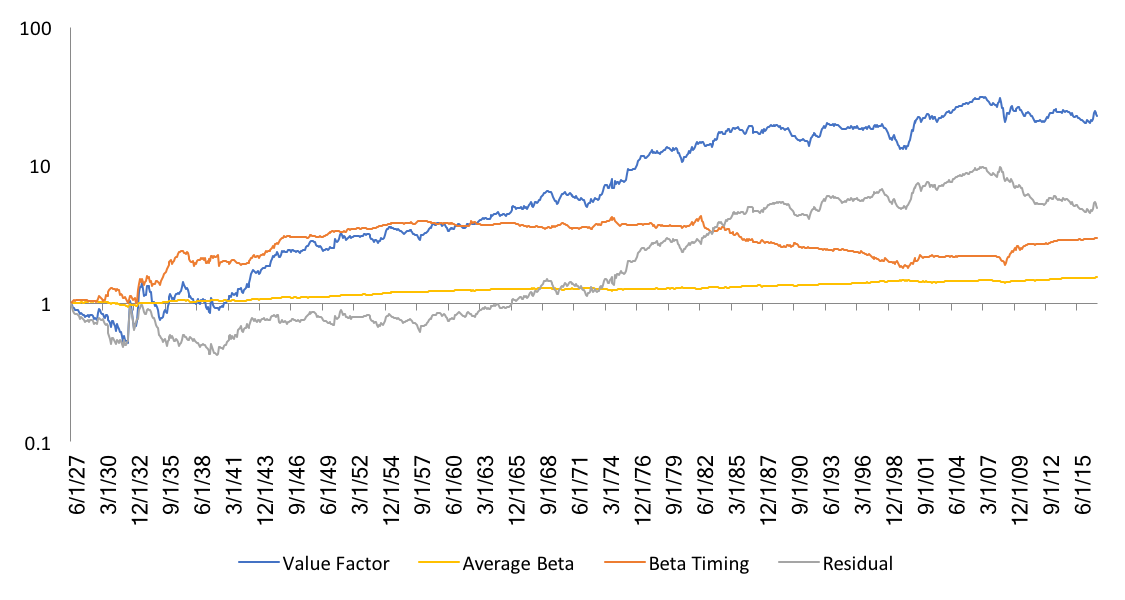
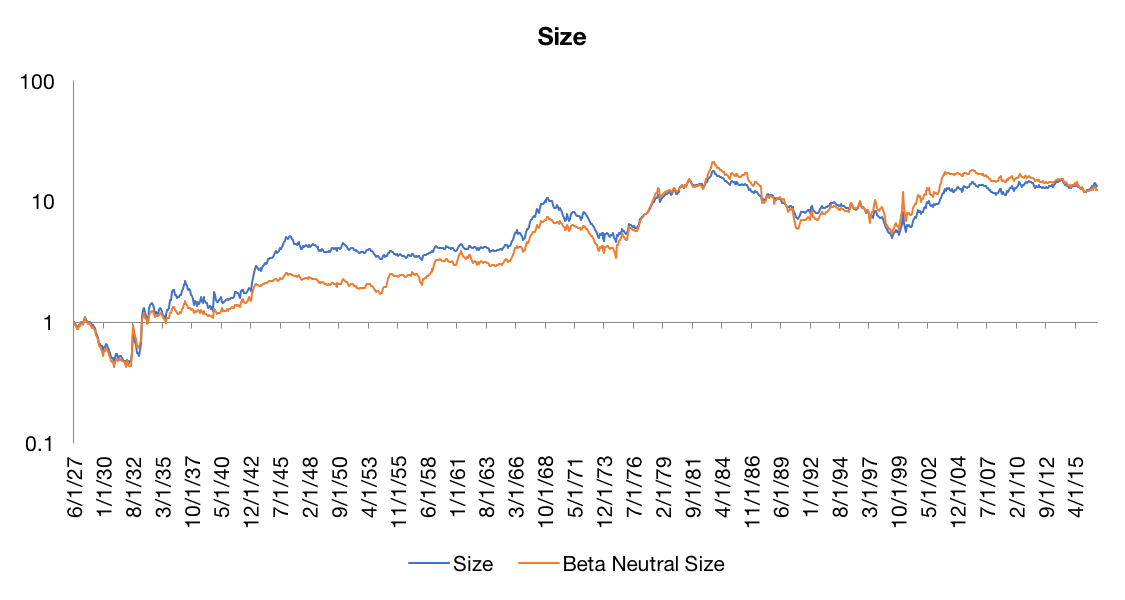
The Size Factor
Source: Kenneth French Data Library. Calculations by Newfound Research.
- Long-term average beta exposure was a positive contribution of about 0.41% per year, in line with the idea that small-caps typically have higher beta than large-caps.
- Beta timing was a drag of -0.18% per year. Again, we can see that the results here were very regime dependent. From the 1950s through the late 1990s, beta timing was a significant drag on performance. On the other hand, it has been a tailwind over the last 17 years.
- The residual, or beta neutral portion of the factor, accounted for the lion’s share of the return, clocking in at 2.60% annualized.
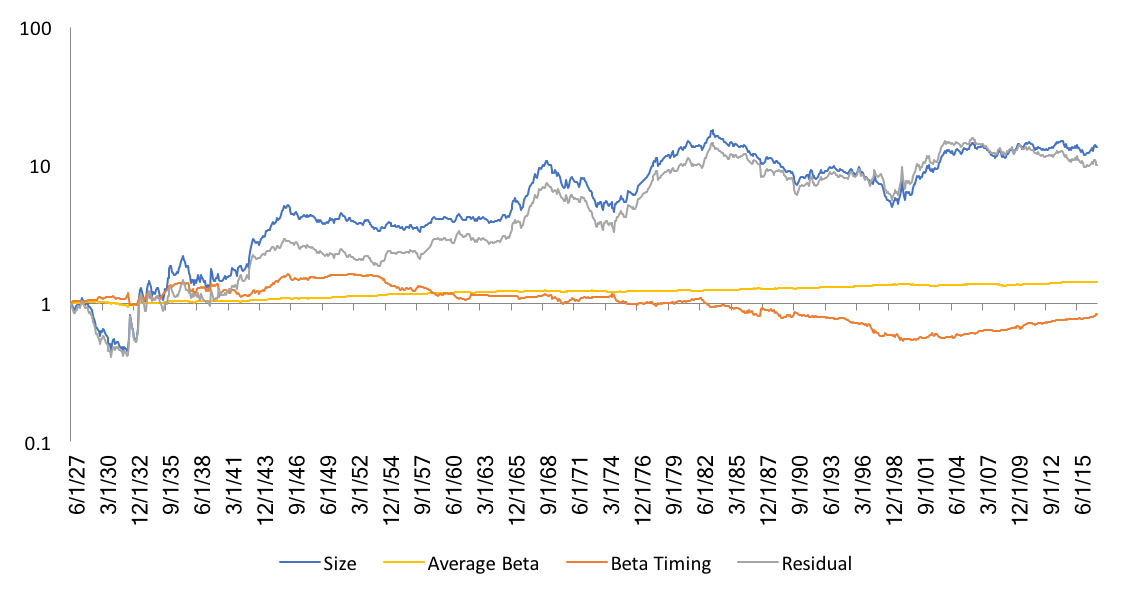
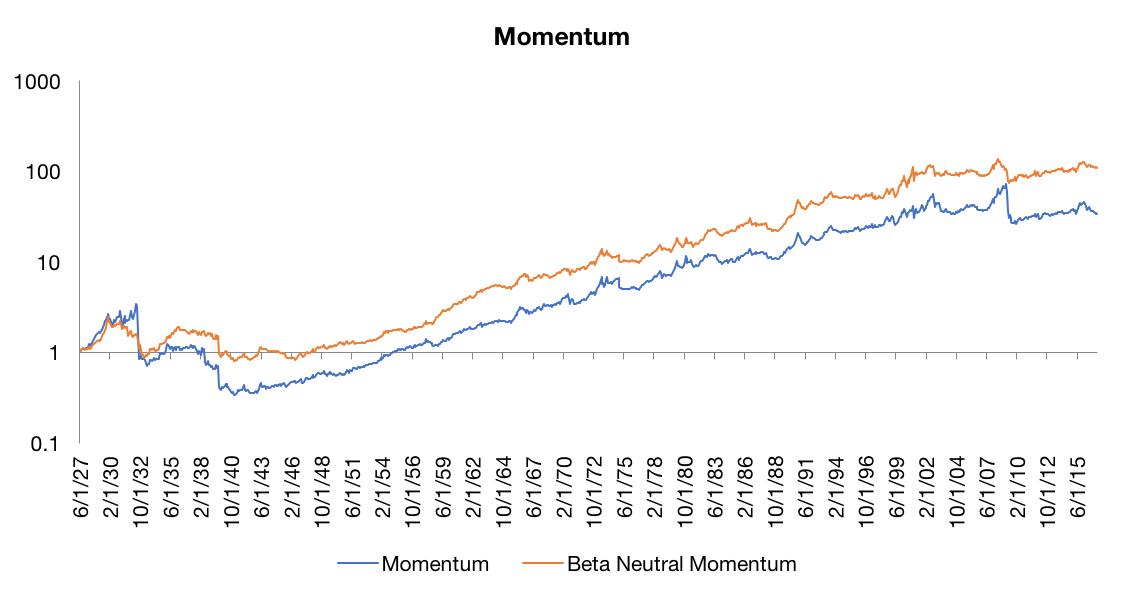
The Momentum Factor
Source: Kenneth French Data Library. Calculations by Newfound Research.
- Long-term average beta exposure added 0.13% per year.
- Beta timing was a drag of -0.54% per year. Again, this result is highly regime driven; from 12/31/1992 to 12/31/2008, the beta timing component returned 3.82% per year.
- Residual account for the lion’s share of the return, clocking in at 4.50% annualized.
Worth noting is that if any of these results are gibberish, it’s likely to be momentum as momentum portfolios are the least stable and therefore it is likely that using our past realized beta estimate as a forecast for current beta has the highest degree of error.
Beta-Neutral Portfolios
One way of addressing the confounding impacts of time-varying beta exposure is by attempting to construct factor portfolios that are beta neutral instead of dollar neutral. To do this, we scale each leg such that its beta is equal to 1 (lending and borrowing at the risk-free rate as necessary).
Source: Kenneth French Data Library. Calculations by Newfound Research.
Source: Kenneth French Data Library. Calculations by Newfound Research.
Source: Kenneth French Data Library. Calculations by Newfound Research.
| Ann. Return | Ann. Volatility | Ann. Sharpe (rf = 0) |
Max Drawdown | |
| Value | 3.55% | 13.68% | 0.26 | 48.59% |
| Beta Neutral Value | 2.17% | 11.06% | 0.20 | 52.51% |
| Size | 2.94% | 16.49% | 0.18 | 72.23% |
| Beta Neutral Size | 2.85% | 17.17% | 0.17 | 74.66% |
| Momentum | 4.00% | 21.81% | 0.18 | 90.02% |
| Beta Neutral Momentum | 5.37% | 15.86% | 0.34 | 67.60% |
We can see that “neutralizing” beta had varying effects. Most prominently, however, it decreased returns for the value factor by 138bp per year. Equally as interesting is the improvement to both return and risk for the momentum factor (again, acknowledging that if any of these results are a case of “garbage in, garbage out,” this would be it.)
Conclusion
So what’s the take away? Is value an overstated factor, buoyed by early help from beta timing? Is momentum safer if we balance the beta risk?
If past factor returns are predictive of future returns (why else would we bother with them?), does that include the average beta and beta timing components?
One potential argument here is that even if factors are driven entirely by beta timing, they could simply be capturing dynamic sentiment changes in the market and intelligently betting on it. For example, while beta timing drove a substantial amount of the total return of the value factor from 1927 to 1957, the methodology of value investing may have been an intelligent way of harvesting changing investor views on risk during the period.
In other words, beta timing may very well be a feature, and not a bug, of factor investing.
[1] https://blog.thinknewfound.com/2017/03/factors-smart-beta/
