
ETFs are the instrument of choice for millions of investors in the U.S. Through a single trade and for a relatively low price, an investor gains broad exposure to a market, sector or niche. They don’t have to go out and purchase dozens of individual securities for diversification. But knowing what you’re investing in isn’t the same as understanding how much it’ll cost. When going grocery shopping, it’s simple enough to look up the item’s value online to see if you’re getting a good deal. However, ETF prices have nuances that can’t be easily observed “on the shelf.”
The ETF Recipe
As implied by the name, all ETFs trade on exchanges with transactable market prices. Most disclose their holdings on a daily basis. Mutual funds, in contrast, are not listed on any exchange, and they can go months without disclosing their holdings. ETFs do have a daily net asset value (NAV) that is set at the end of the each trading day, just as a mutual fund has. But they also have intraday prices as they trade throughout the day. Mutual fund share transactions only finalize after the market close.
Within the range of products trading in an ETF wrapper, there is significant variety. Select two funds at random, and there can be myriad differences between them, even if they cover the same subsector. For example, a long-term investor buying an ETF with an expense ratio of 0.03% could actually fare worse than if they had bought an otherwise identical ETF with a fee three times as high due to something as simple as how liquid the funds are.
There are many small factors that can affect the cost of an ETF. Most of the time, if you know what to look for, you can find the most important elements of an ETF’s price on its publicly available product page. However, sometimes you need to dig into the prospectus, a formal, legally mandated document that provides detailed information about the fund.
Below, we cover three of the most important elements. You can use them to determine whether you’re getting the best deal possible for an ETF.
Expense Ratio
The expense ratio represents the annual cost associated with managing and operating the ETF. It includes things like management fees, administrative costs, and other operational expenses, and is presented as a single line item. This fee accrues daily, and the issuer deducts it directly from the fund’s assets. Because of that, it affects the returns investors receive.
The presentation of a single number makes investors’ jobs easier during their due diligence process. If curious however, you could easily find its components on the first couple pages of the prospectus. In the case of VFH, the total fee includes the management fee of 0.09%, payable directly to Vanguard. It also includes 0.01% in unspecified “other expenses.” That term can encompass legal and audit fees, custodian fees, trustee fees, or any number of expenses that do not go directly to the fund sponsor.
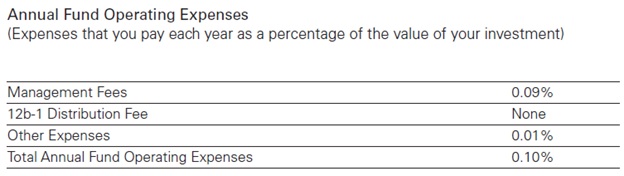
Source: Vanguard Financials ETF (VHF) summary prospectus
Furthermore, note that the 12b-1 distribution fee states “none.” Such fees date all the way back to the Investment Act of 1940. That legislation permits the use of fund assets to pay distribution-related expenses such as marketing.
12b-1 fees force investors to pay for the marketing and selling of the fund to new investors. However, that doesn’t directly benefit existing shareholders. Under the Act they can be as high as 1%, but usually are less than 0.5%. Luckily for ETF investors, these fees are mostly a relic of the mutual fund landscape. The ETF industry is highly competitive and very, very few fund families have these fees. State Street stands out as an asset manager charging 12b-1 fees, but even then they are in the single digit basis point range and trending downwards.
In another key difference from mutual funds, ETFs are free of front-end or back-end load fees. Mutual funds can come with front-end load fees. Those are basically sales charges that serve as compensation for the brokers and financial advisors that recommended or facilitated the transaction. Such loads ranging between 4% and 5% are common. Meanwhile, a back-end load, formally known as the contingent deferred sales sales charge (CDSC), is less common. However, an investor exiting a fund may incur a charge.
A Bond ETF Example
Within VettaFi’s ETF database, entire categories of funds can be sorted to compare them based on expense ratio. In the example below, State Street’s SPDR Portfolio Corporate Bond ETF (SPBO) ranks as the cheapest broad market corporate bond ETF, with a 0.03% fee. This can be compared with other broad corporate bond ETFs such as the Vanguard Total Corporate Bond ETF (VTC) which charges 0.04%, or the iShares Broad USD Investment Grade Corporate Bond ETF (USIG), also priced at 0.04%.
The expense ratio should never be an investor’s sole criteria in deciding between funds. First, they must decide if the funds they are considering cover the part of the market they are looking to invest in. They should also dig into the methodology underlying the fund or its index so that they have a reasonably good idea of what the coverage of the fund might look like in the future.
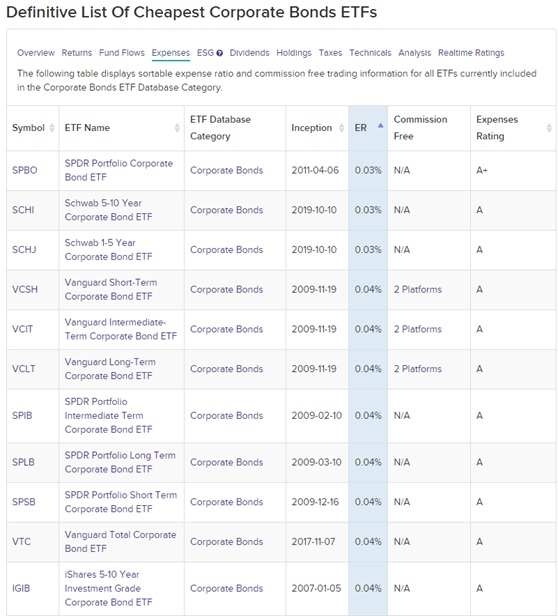
List of Corporate Bond ETFs sorted by expense ratio. Source: ETFdb.com.
Premium & Discount
When used in the context of an ETF, premiums and discounts describe the difference between an ETF’s market price and its NAV. The NAV is the value of all the ETF’s assets minus liabilities and divided by the number of shares outstanding. Meanwhile, the market price is what the ETF trades at on an exchange at any given time. Given that ETFs trade like stocks, they’re bought and sold throughout the day with their prices determined by supply and demand.
Premiums and discounts refer to the ETF’s share price relative to its NAV. A fund trading at a price above its NAV is trading at a premium, but it’s trading at a discount if its price is below its NAV. These premiums and discounts are unique to ETFs as mutual fund share transactions occur once per day after the market close based on end-of-day prices. Significant premiums and discounts are rare in the ETF industry as it’s the job of market makers and authorized participants to keep those to a minimum.
Why is this important? Let’s start by using a real-world example, the Invesco Aerospace & Defense ETF (PPA). The graph below illustrates the closing ETF price and NAV with daily observations, from Aug. 17, 2020 through Aug. 16, 2023. The fund has about $2 billion in AUM and holds all U.S.-listed equities, so the ETF price and NAV trend closely.
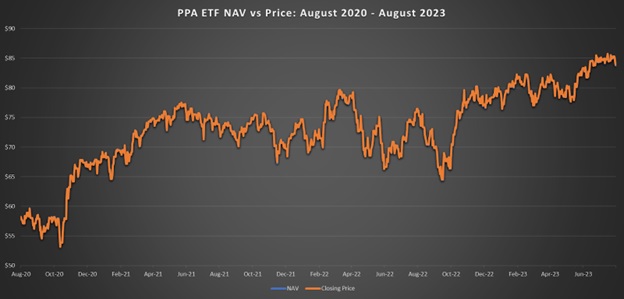
Source: Invesco, Yahoo Finance
A more useful visualization is the premium itself; when dealing with ETFs in this competitive landscape, every basis point counts. As expected, the average premium or discount is extremely tight at 0.004%. Note this is an average, and the fund seldom closes trading with its price exactly equaling NAV. The daily dispersion ranges from a premium of 0.21% on Dec. 1, 2021 to a discount of -0.14% on Nov. 2, 2020.
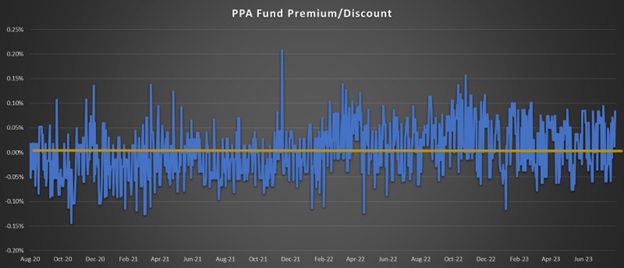
Source: Invesco, Yahoo Finance
If you bought the fund on Dec. 1, 2021, you were essentially paying 0.21% more than the value of the underlying securities. The total return would not only include the management fee, but also the difference between the premium when purchased and the premium or discount when sold. In the case of PPA, the total expense ratio is 0.58%. Assuming a one-year holding period after which the fund closes flat to NAV, one’s return versus the index would be approximately 0.79% less (-0.58% + -0.21%). This does not include the impact of transaction costs.
As a rough rule, the more an ETF trades throughout the day (i.e. the more liquid it is), the tighter the spread will be between ETF price and NAV. The liquidity of the underlying can also influence the premium. For example, an ETF holding bonds in emerging markets will probably have wider spreads than those tracking the S&P 500.
ETF Transaction Costs
Colloquially known as “t-costs,” transaction costs are the expenses incurred by the ETF when it buys and sells securities to track its benchmark index or maintain its investment strategy. T-costs span a broad spectrum,: But unlike the other costs we’ve discussed, they are not necessarily apparent or immediately observable by an ETF’s shareholders.
Things like brokerage commissions and bid/ask spreads are things that any investor or trader deals with, of course. However, other costs are something the average investor likely doesn’t encounter. For example, “liquidity impact” occurs when a large trade actually moves the price of the security in a transaction. There’s also foreign exchange costs if the fund holds non-U.S. stocks. Additionally, “cash drag” can impact the investor’s return if the fund doesn’t immediately reinvest dividends or interest.
T-costs are basically the residual difference between a fund’s pre-fee and post-fee return, after accounting for the expense ratio. If a fund with a 0.70% expense ratio earned 10% on a total return (NAV) basis over a one year period but its index earned 11%, about 0.30% was likely “lost” due to t-costs.
The prospectus will always outline the fund’s turnover, or the rate at which the fund’s holdings are bought and sold over a specific period, typically a year. This provides an indication of the fund’s trading activity. A low turnover rate is typical of an indexed, buy-and-hold strategy where rebalancing may occur anywhere from once a month to once a year.
In contrast, a high turnover is mainly typical of an active trading strategy. The fund manager may frequently buy and sell securities, potentially aiming to capitalize on short-term market trends or movements. Note that some indexed strategies, such as those within fixed income, naturally require high turnover, and may not be a good predictor of t-costs.
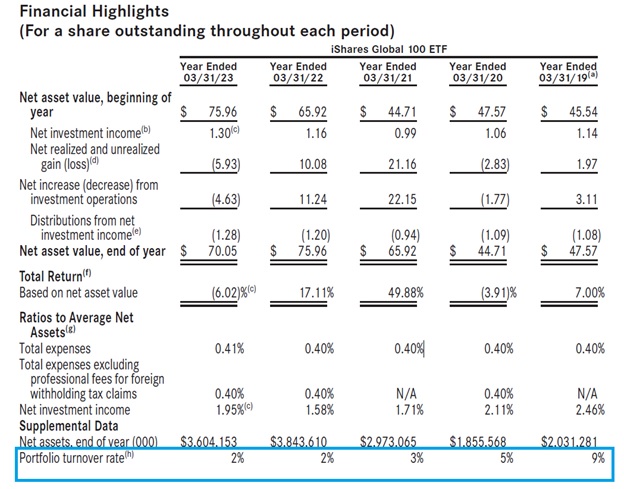
Historical turnover rate for the iShares Global 100 ETF (IOO). Source: iShares.
Putting It All Together
Investing in ETFs offers a unique combination of broad exposure, transparency, and liquidity. However, the true value of an ETF is not only in its holdings. An investor should also understand its associated costs and structural nuances. At face value, two ETFs might seem almost identical. However, their costs, both apparent and embedded, can greatly influence the overall return on investment.
High fees are more pronounced over long time periods. Not only is one’s capital lessened by the expense ratio, but all the future potential earnings that money could have generated if it had been left to compound are lost as well. Even if an ETF returns 7% annually, a 1% expense ratio effectively reduces that return to 6%. Over a span of several decades, that 1% difference can equate to a substantial amount of money. In the example below, $10,000 is invested at Year 0 and withdrawn at Year 30. The difference between a 6% and 7% return exceeds $20,000 ($81,645 vs $60,488).
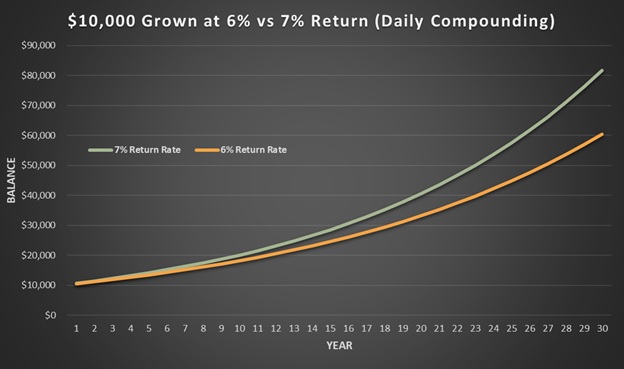
Source: Calculator.net
Some funds might justify high fees by claiming superior performance or active management strategies. However, over the long term, many actively managed funds do not consistently outperform their benchmark indices, especially after including fees. Many times, high transaction costs from excessive portfolio churn exacerbate the poor return of these active strategies.
For retail investors, the key takeaway is to approach ETFs with a keen eye. Always consider the total cost of ownership, not just the headline expense ratio. Understand that trading dynamics, such as liquidity and the nature of underlying assets, can influence premiums and discounts. And remember that while ETFs are generally transparent and liquid, their intricacies require a bit of homework. Knowledge and due diligence can lead to better investment decisions and, ultimately, better returns.
For more news, information, and strategy, visit the Financial Literacy Channel.
