
Here is a look at real (inflation-adjusted) charts of the S&P 500, Dow 30, and Nasdaq composite since their 2000 highs. We’ve updated this through the April 28, 2023 close.
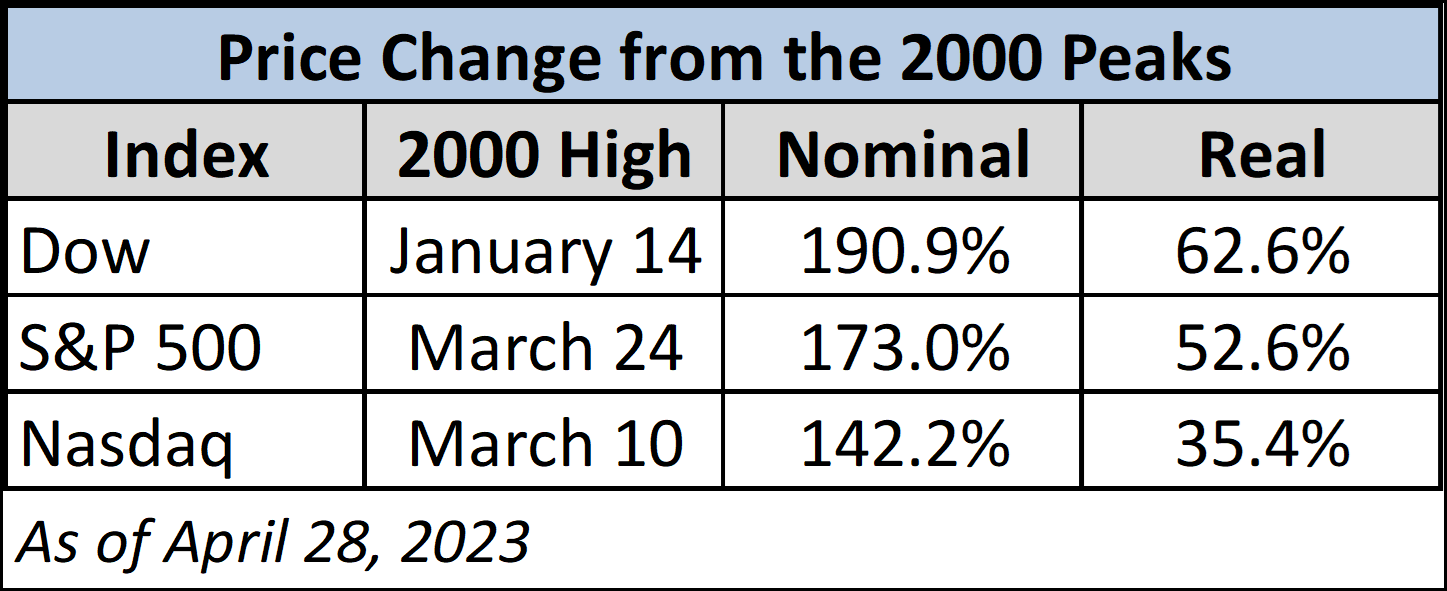
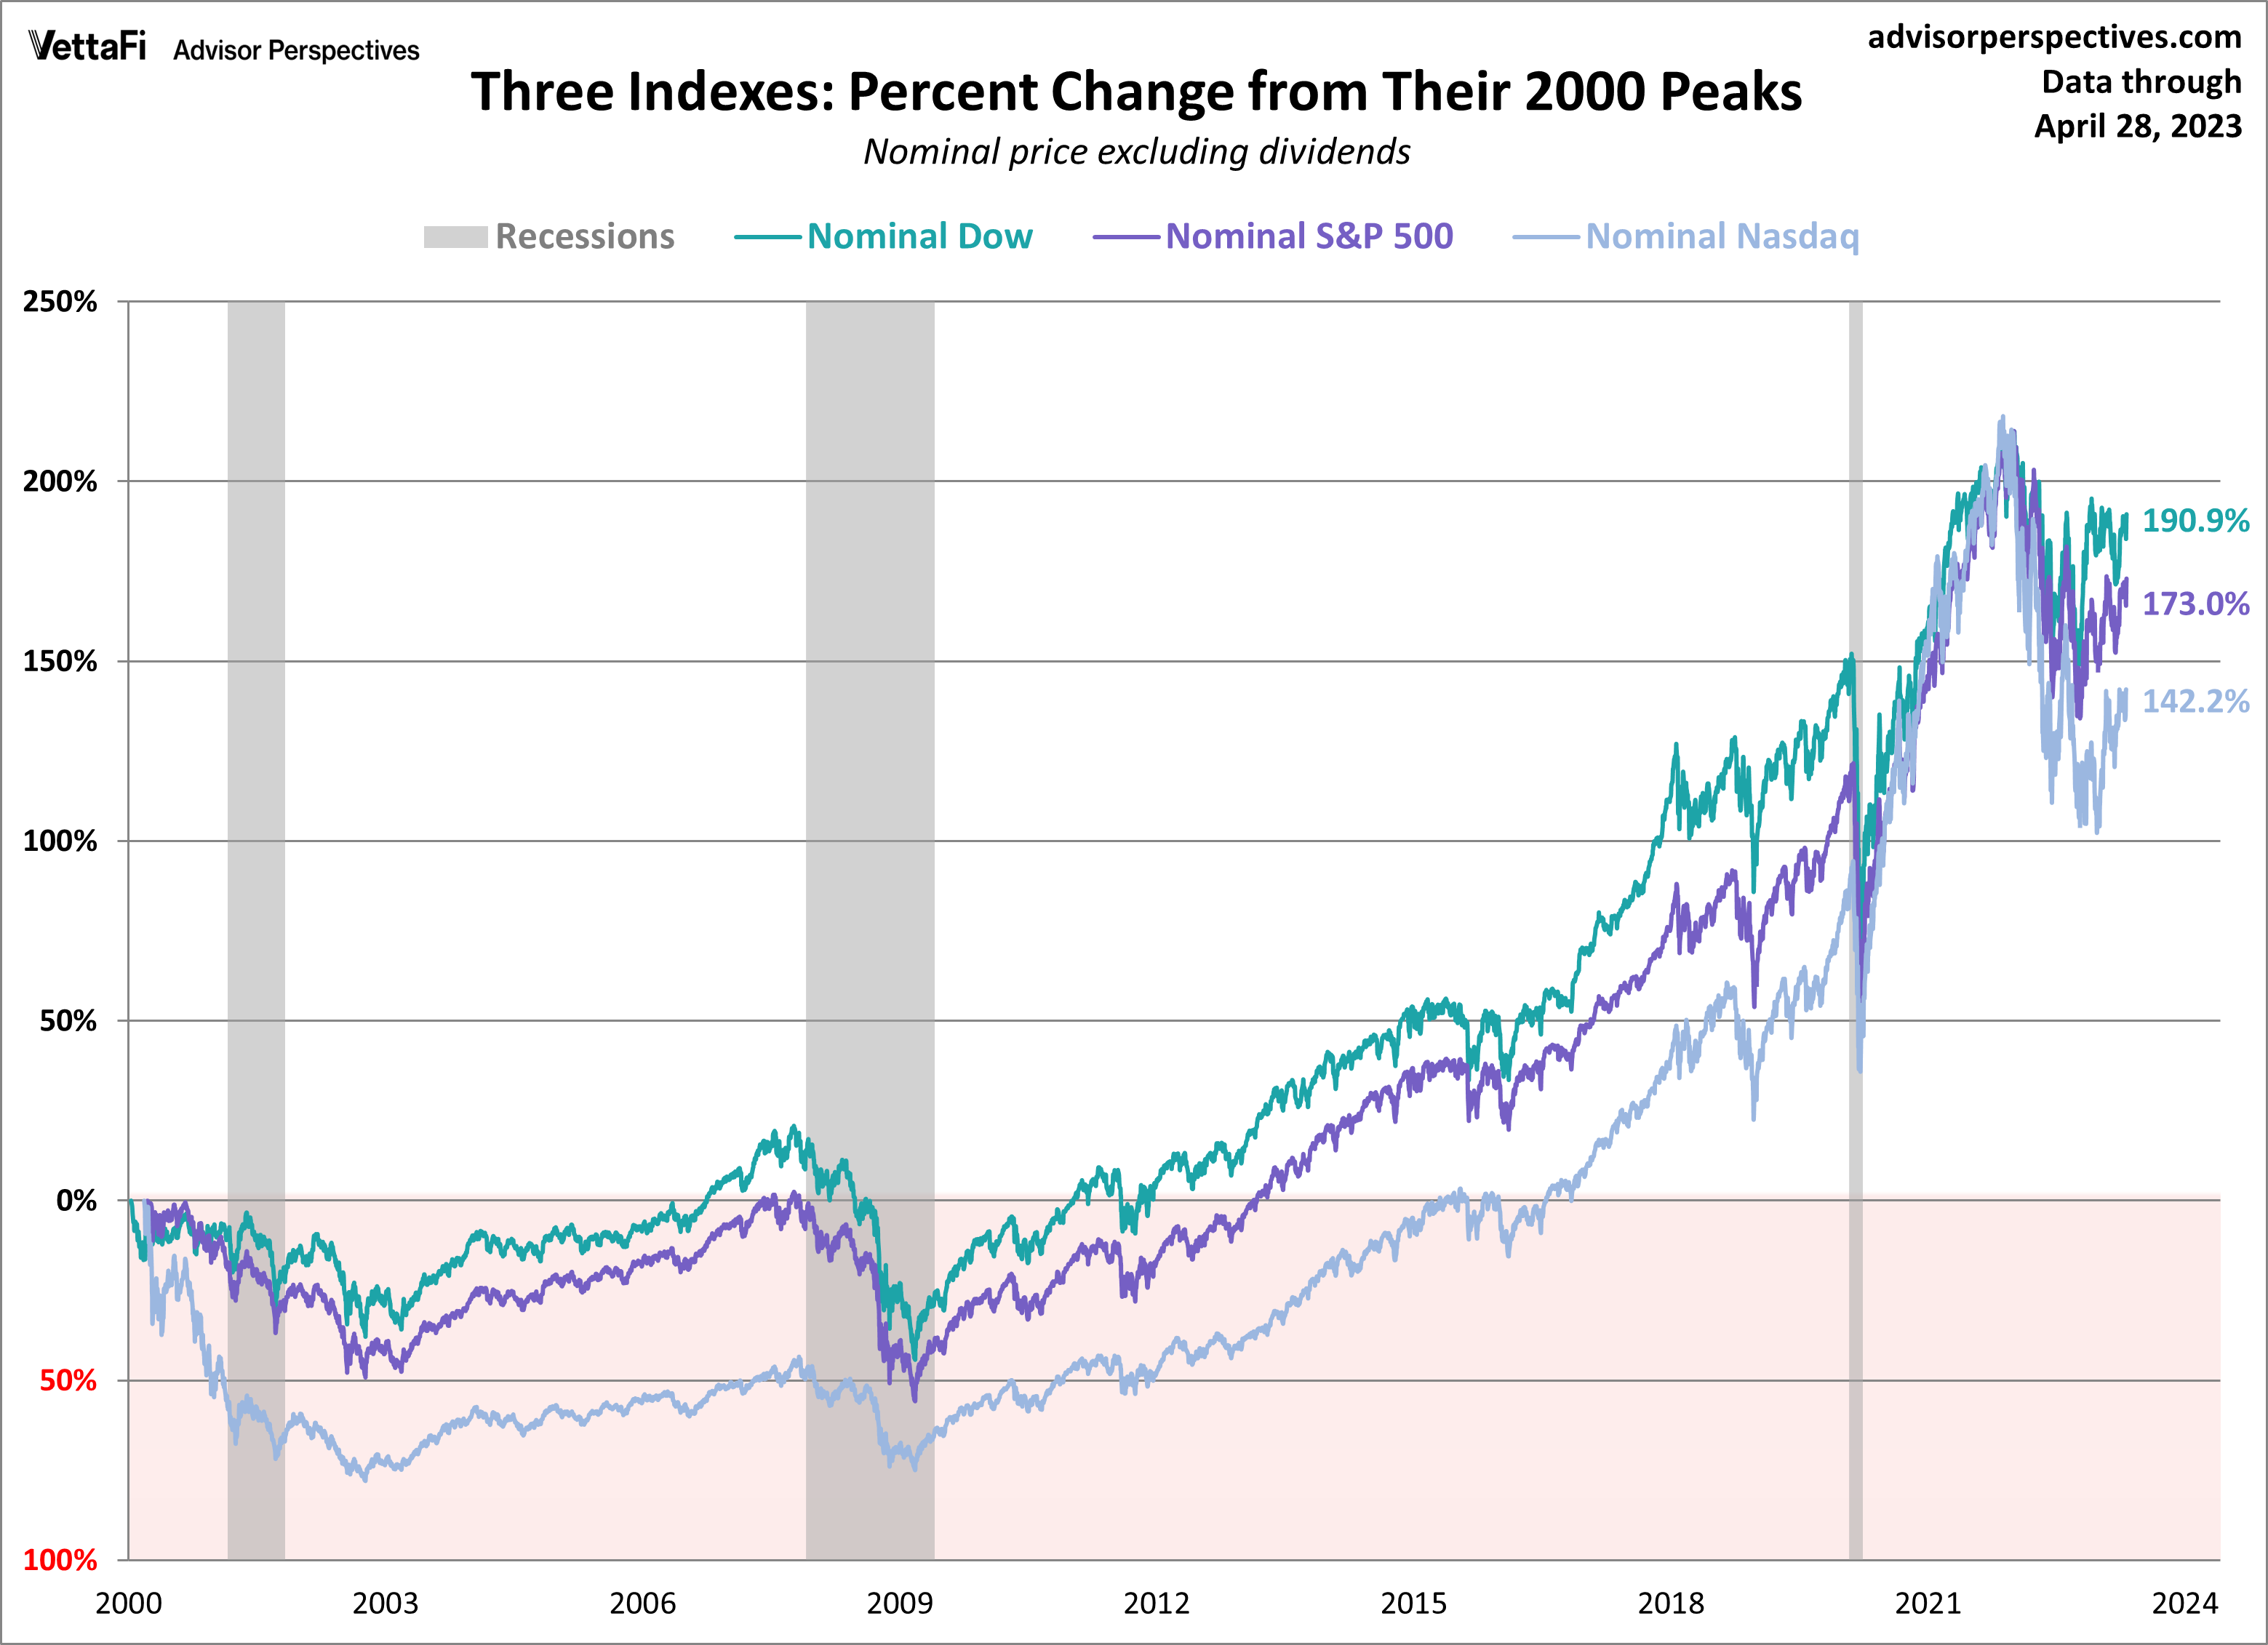
Here are two overlays — one with the nominal price, excluding dividends, and the other with the price adjusted for inflation based on the consumer price index for urban consumers (which is usually just referred to as the CPI). As of April 28, all three indexes are up from the last day of March with the Dow up 2.5%, the S&P up 1.5%, and the Nasdaq up 0.04%.
When adjusted for inflation, the real month-over-month changes for each index become 1.7% for the Dow, 0.7% for the S&P 500, and 0.8% for the Nasdaq.
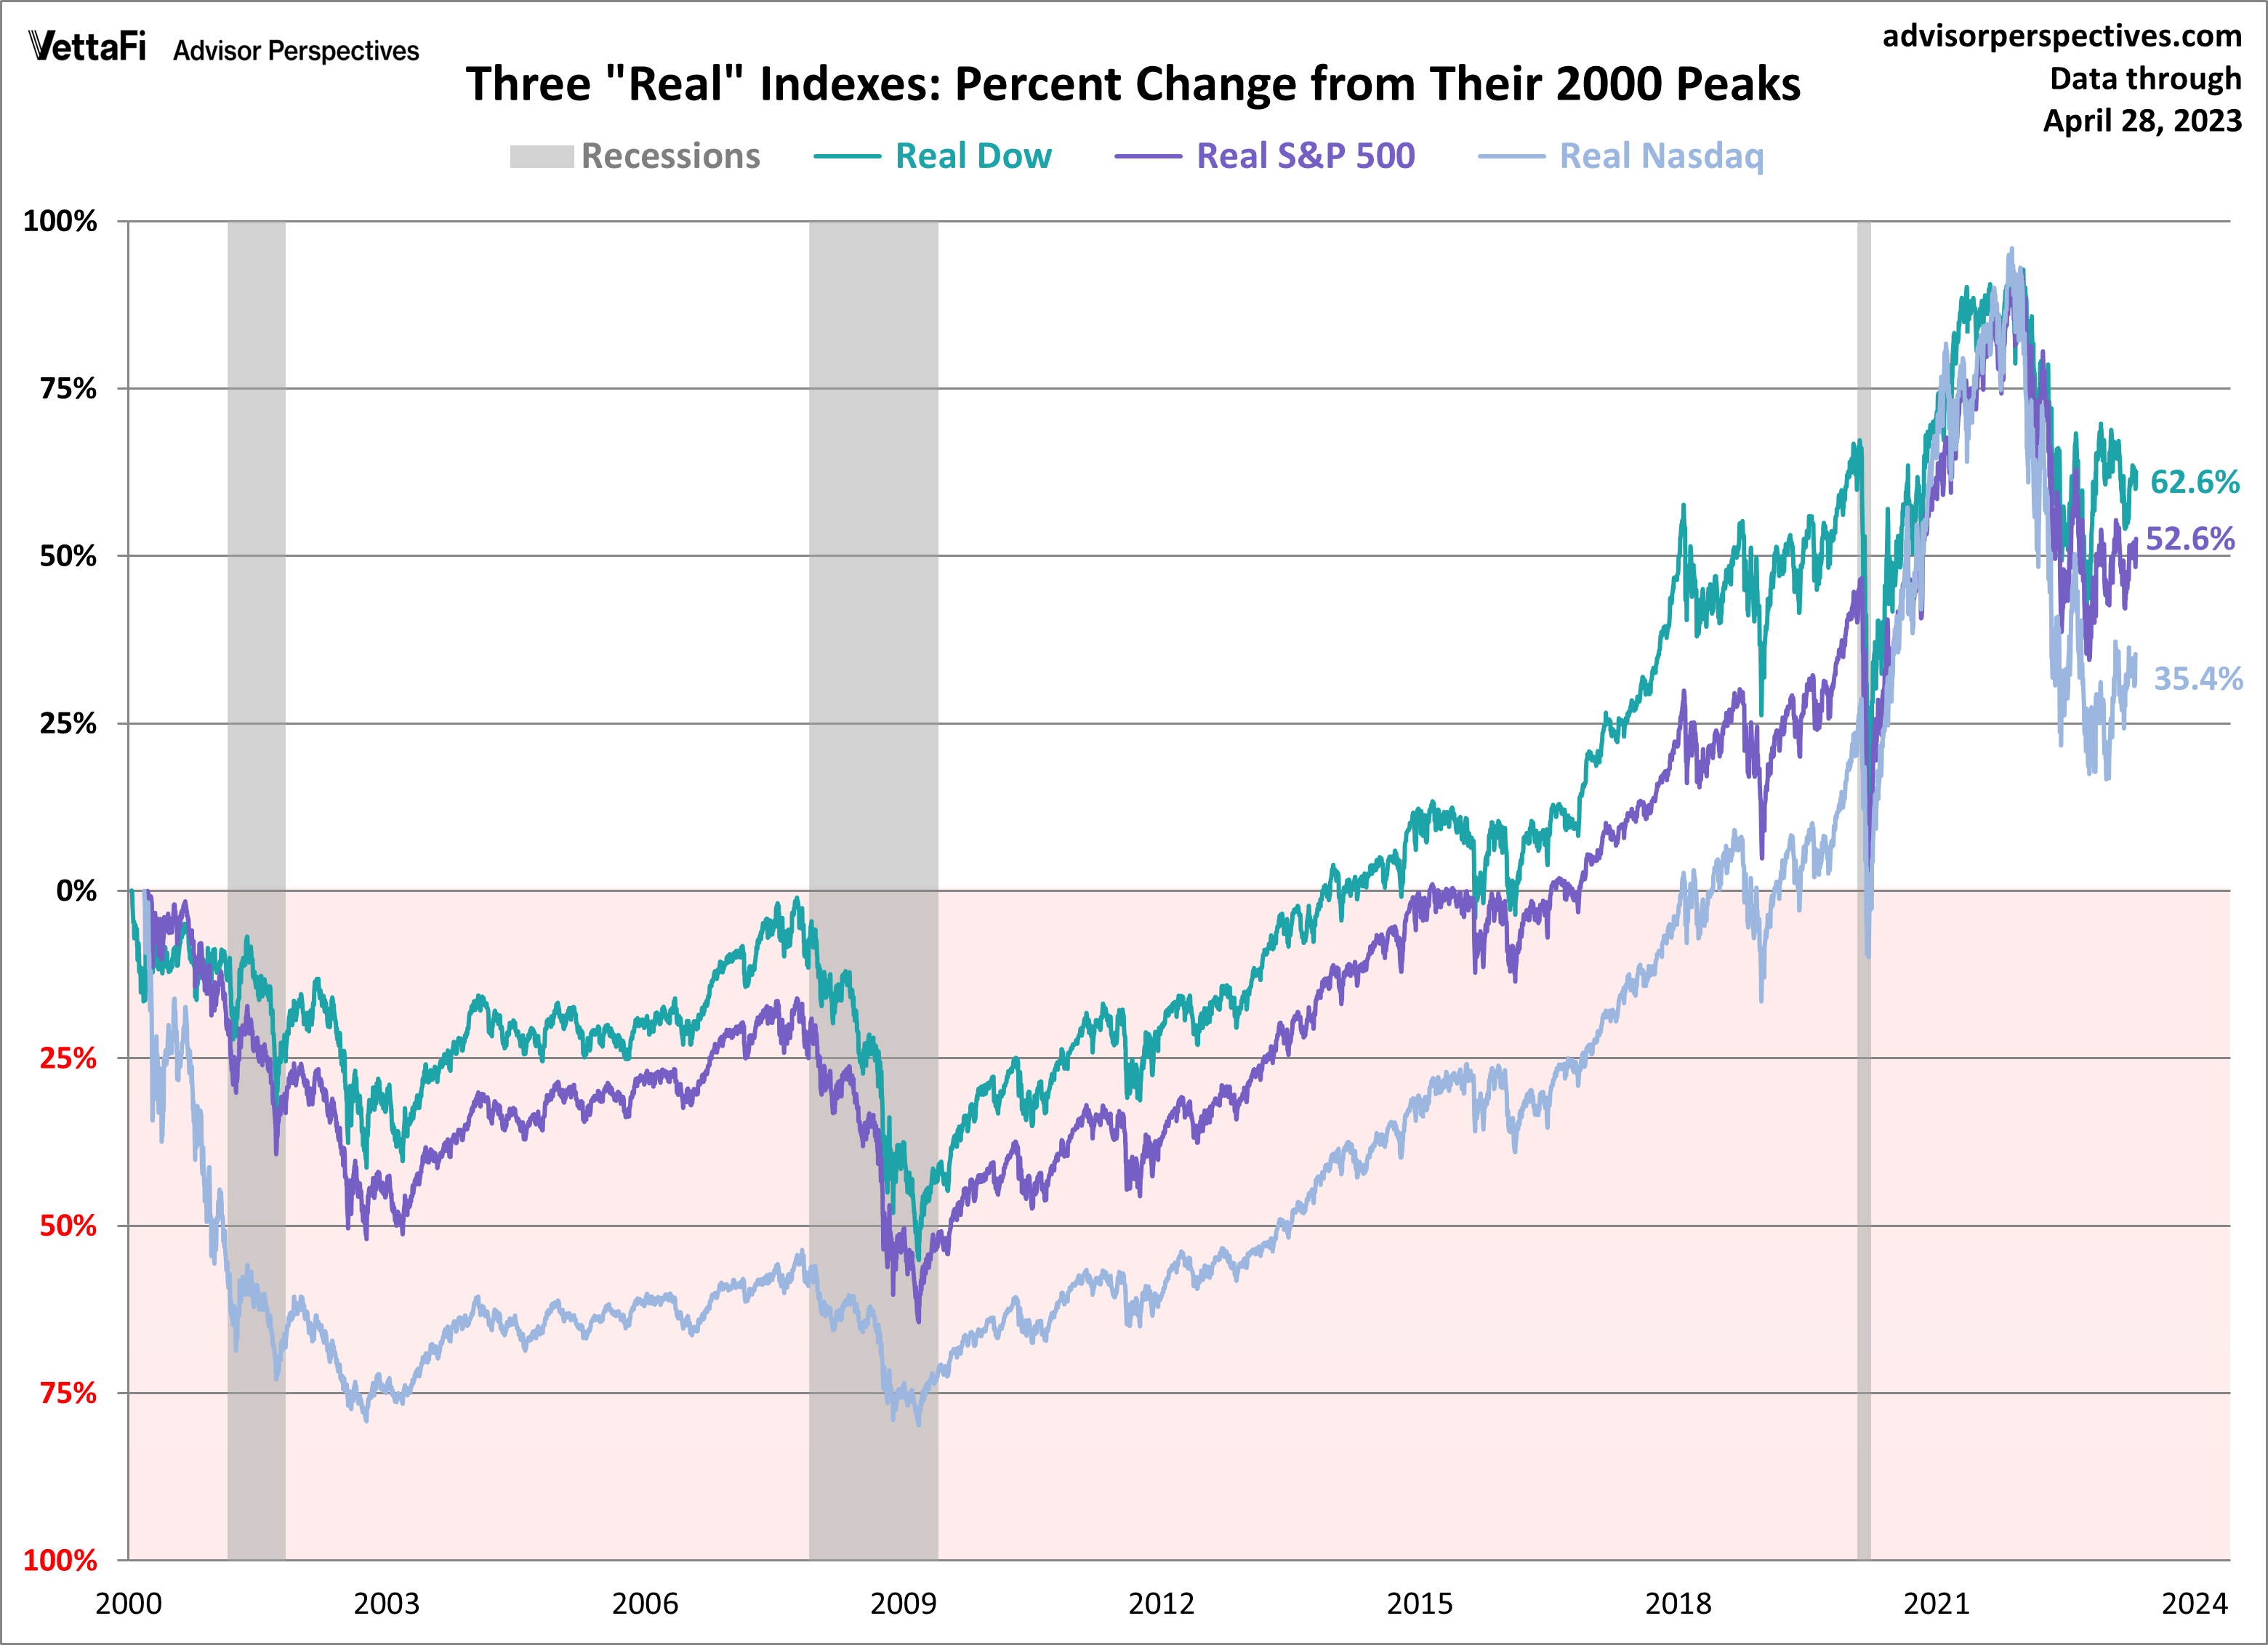
The charts require little explanation. So far, the 21st century has not been especially kind to equity investors. Yes, markets do bounce back, but often in time frames that defy optimistic expectations.
Read more: World Markets Update, May 1
Performance of the SPY ETF
The charts above are based on price only. But what about dividends? Would the inclusion of dividends make a significant difference? Let’s take a look at the return on $1,000 invested in the SPY ETF at its March 2000 peak.
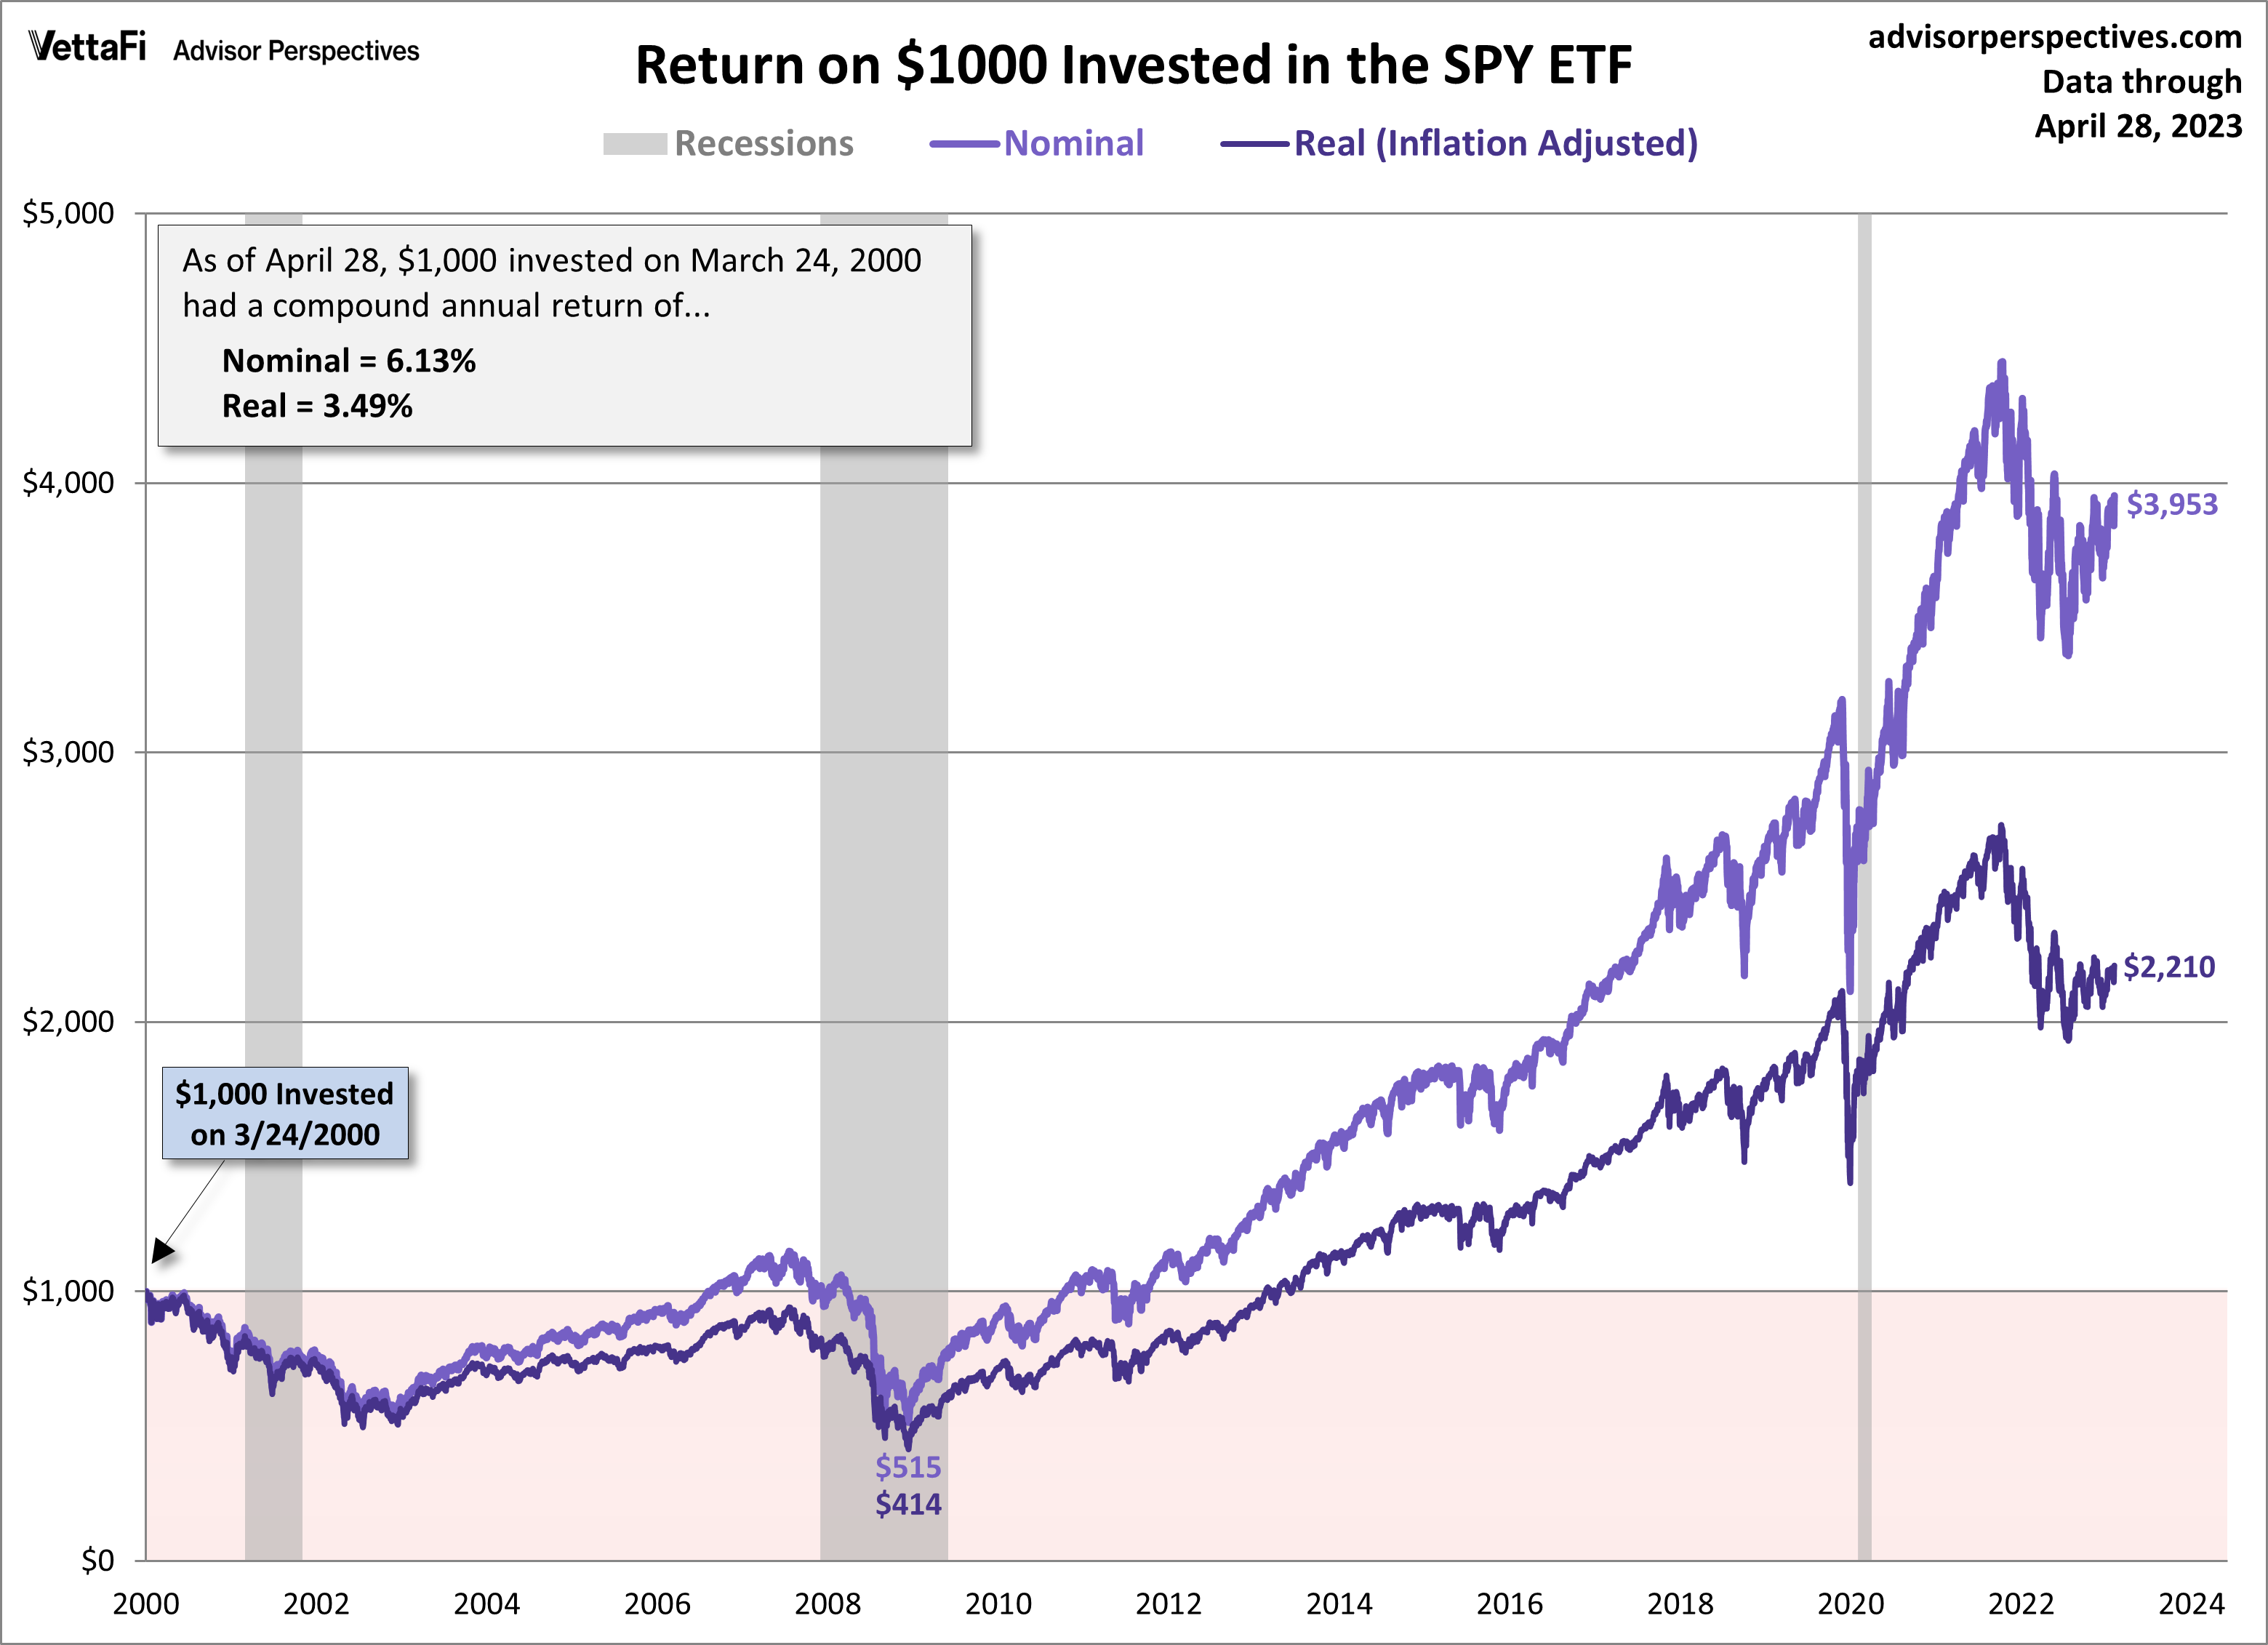
The total return certainly looks better over 20 years later, but the real (inflation-adjusted) purchasing power of that $1,000 is currently $2,210 above break-even, a real compounded annual return of 3.49%.
Performance of the DIA ETF
Now, let’s take a look at the return on $1,000 invested in the DIA ETF at its January 2000 peak.
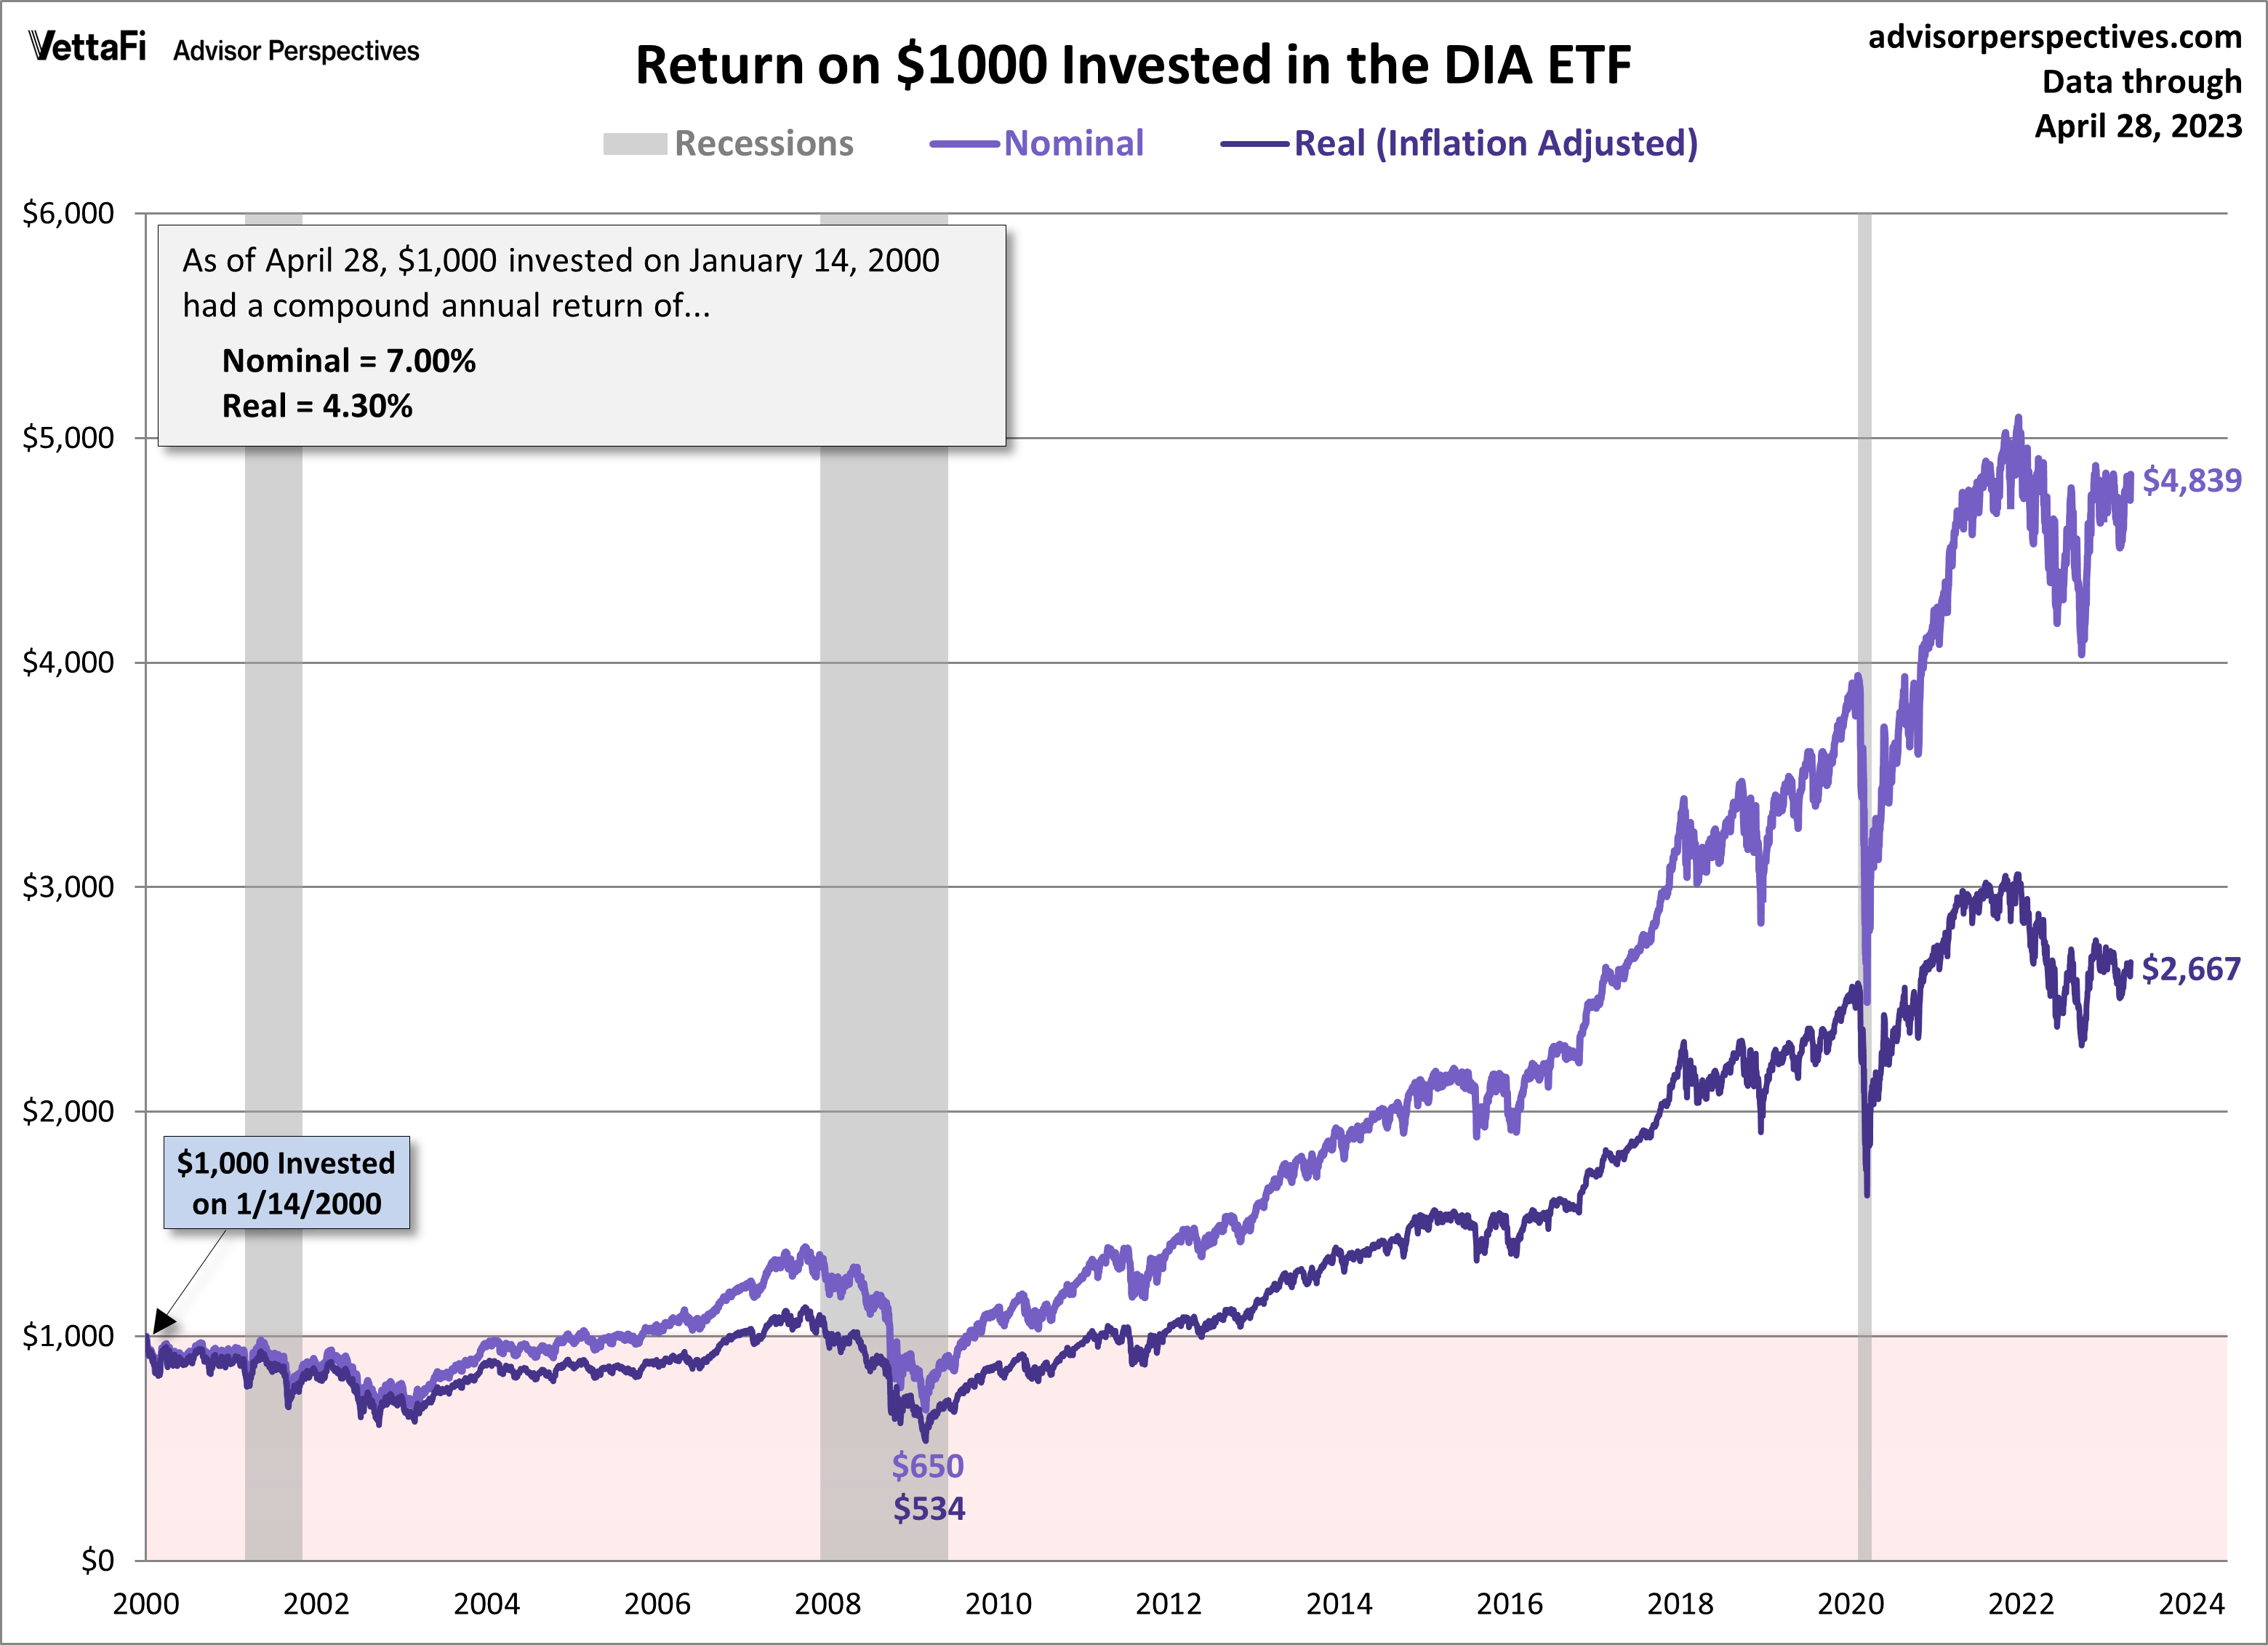
Again, the total return looks better over 20 years later, but the real purchasing power of that $1,000 is currently $2,667 above break-even, a real compounded annual return of 4.30%.
Performance of the QQQ ETF
Lastly, let’s look at the return on $1,000 invested in the QQQ ETF at its March 2000 peak.
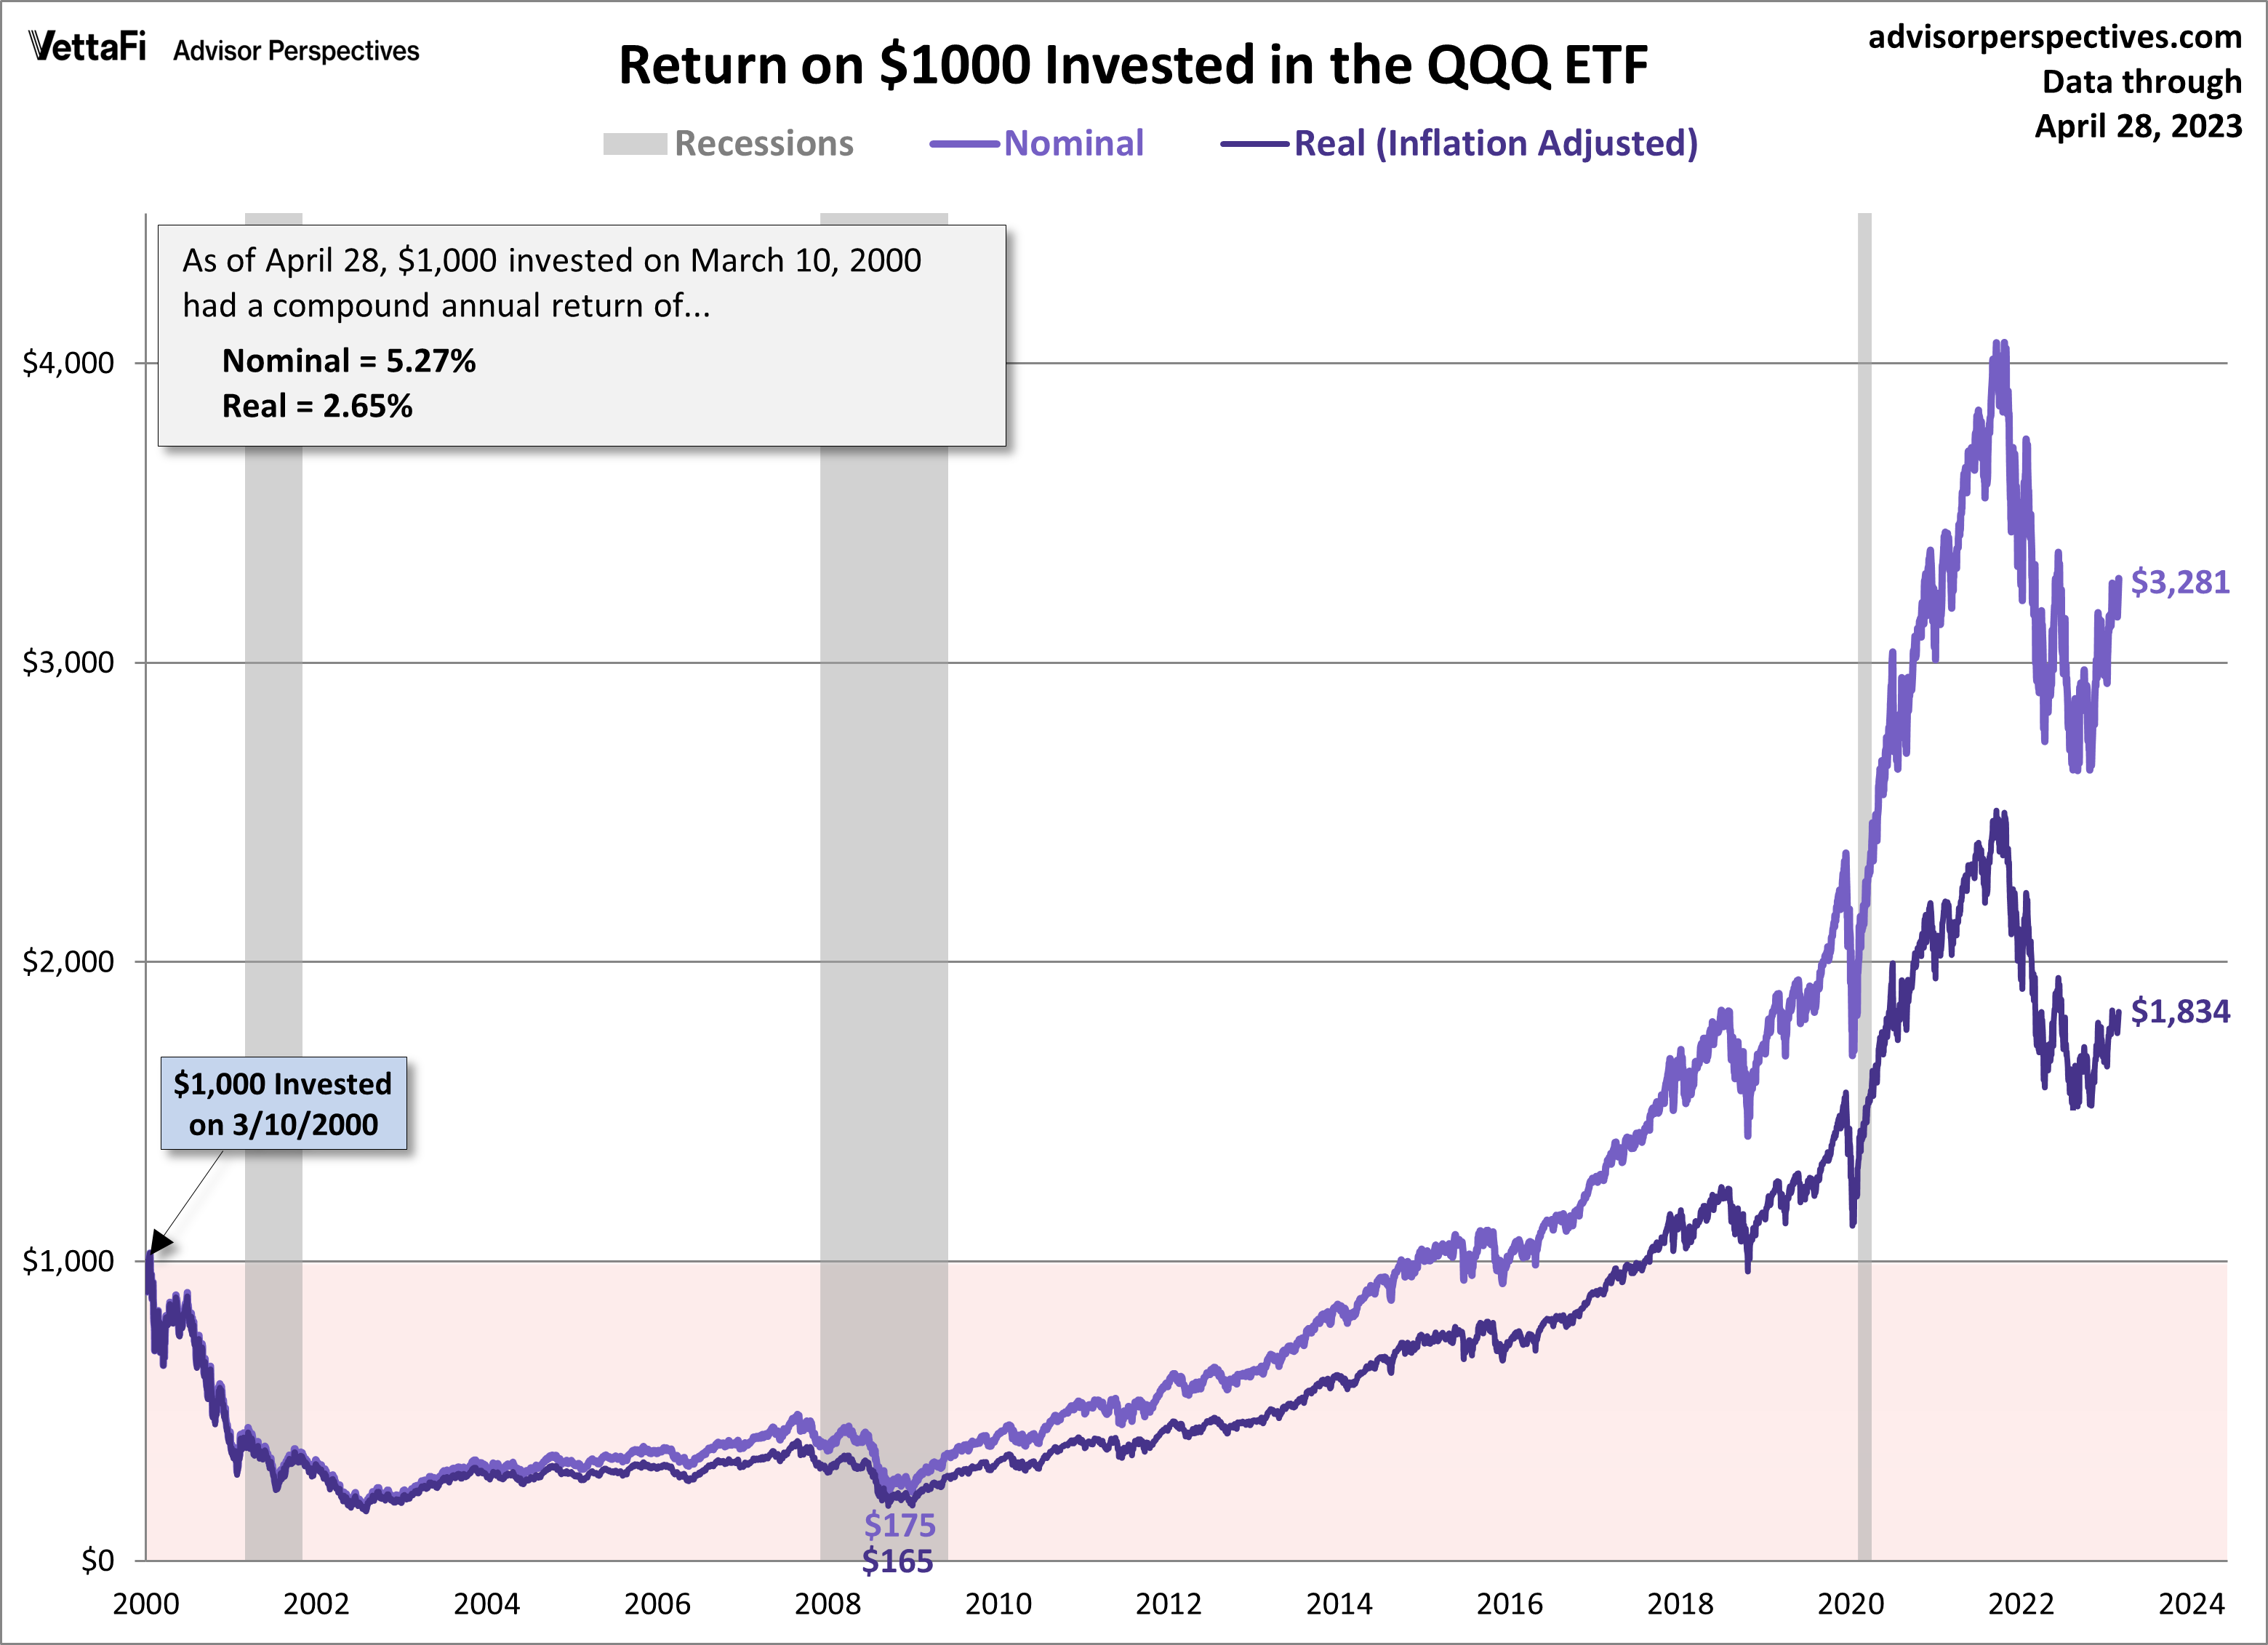
The real purchasing power of that $1,000 is currently $1,834 above break-even, a real compounded annual return of 2.65%.
For more news, information, and analysis, visit the ETF Education Channel.