
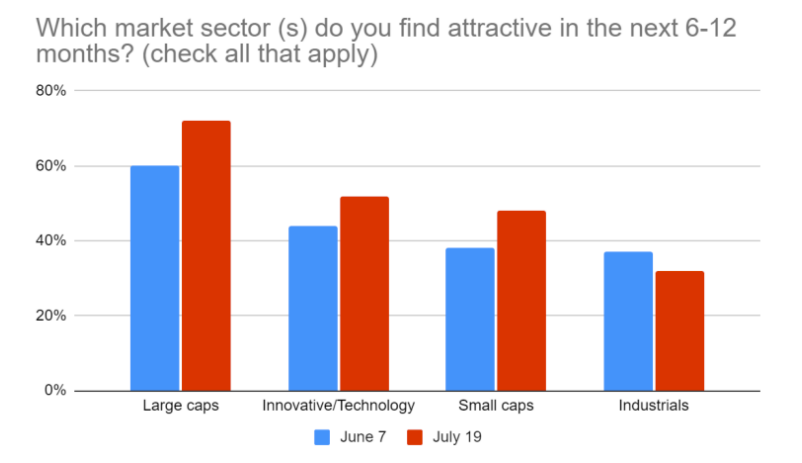
While U.S. equities remain in a bear market, advisor sentiment is improving across a range of investment styles. In a pair of webcasts hosted six weeks apart by VettaFi with Nationwide, we asked advisors, “Which market sector (s) do you find attractive in the next 6-12 months?” with the option to select more than one. In both polls, large-caps were deemed the most attractive; sentiment improved with 72% of respondents choosing this investment style on July 19, 2022, up from 60% on June 7. Optimism also improved for innovative/technology (to 52%, from 44%) and small-caps (to 48% from 38%). However, advisors were less bullish on industrials, with just 32% of respondents finding them attractive in mid-July, compared to 37% in early June.
While the poll question did not specify individual indexes, the presentation featured Nationwide ETFs that are connected to the S&P 500, the Nasdaq-100, the Russell 2000, and the Dow Jones Industrials Average, so it is logical that these were the benchmarks that advisors were considering when answering the question.
However, advisors should be aware that, for example, only 50% of assets in the Invesco QQQ Trust (QQQ), which tracks the Nasdaq -100 Index, are classified as information technology, as they have become known in a GICS world. Communication services (16%) companies like Alphabet and Meta Platforms, consumer discretionary (16%) firms like Amazon.com and Tesla, and even consumer staples entities like Costco Wholesale and Pepsi are some of the ETF’s top positions, along with information technology companies Apple, Microsoft, and NVIDIA.
There’s even less information technology in the Invesco NASDAQ Next Gen 100 ETF (QQQJ), as this ETF tracks a different NASDAQ Next Generation Index of more moderately sized companies not included in QQQ. Indeed, QQQJ has 38% of assets in information technology companies like Enphase Energy and ON Semiconductor, with 21% in healthcare, 13% in consumer discretionary, 12% in communications services, and 9% in industrials.
Meanwhile, the Russell 2000 index is tracked by the iShares Russell 2000 ETF (IWM), a $53 billion ETF, as well as a few smaller offerings. Yet, IWM is not the small-cap ETF with the most assets, as that distinction is earned by the iShares Core S&P 600 Small-Cap ETF (IJR) and its $65 billion of assets.
You might be wondering what difference in makes, as small-cap ETFs are basically the same. Well, IJR has lost far less ground in the past year, down just 8.4% as of July 25, falling far less than IWM’s 17%. Among the differences between the indexes behind these two iShares ETFs is that IJR’s has a profitability requirement that serves as a quality filter. This plays a role, as IWM has significantly more exposure to healthcare companies (17% vs. 12%) than IJR does but less consumer discretionary (11% vs. 13%).
We are encouraged by the fact that close to or more than half the advisors believe that innovative/information technology and small-caps are appealing despite the threat of even higher interest rates and an aggressive Federal Reserve. However, we hope that advisors understand that it is not as simple as choosing an investment style and then picking an ETF that aligns with it.
To see more of Todd’s research, reports, and commentary on a regular basis, please subscribe here.
For more news, information, and strategy, visit the ETF Education Channel.
