
By Indexology; Jason Ye, Associate Director, Strategy Indices, S&P Dow Jones Indices
In our previous blog, we’ve shown that SPACs tend to be small- and micro-cap companies that have low liquidity. Following the same framework, in this blog we will analyze SPACs’ performance. We found that relative to S&P SmallCap 600®, active SPACs underperformed when seeking the target, delivered abnormal returns during the deal announcement period, and underperformed again post-merger.
SPACs’ Performance Peaks Leading Up to Announcement Day
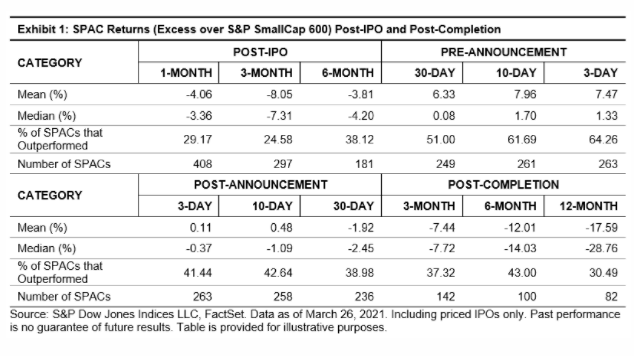
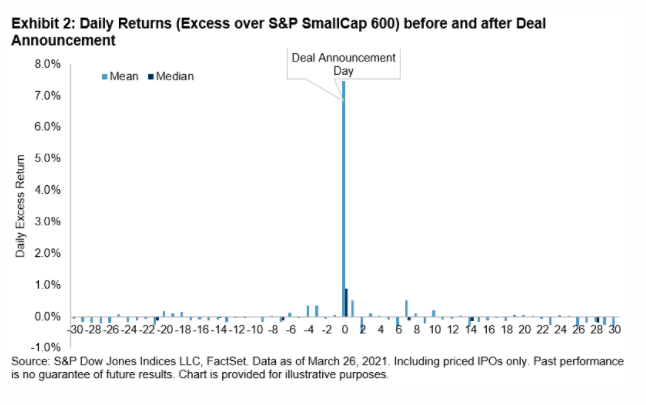
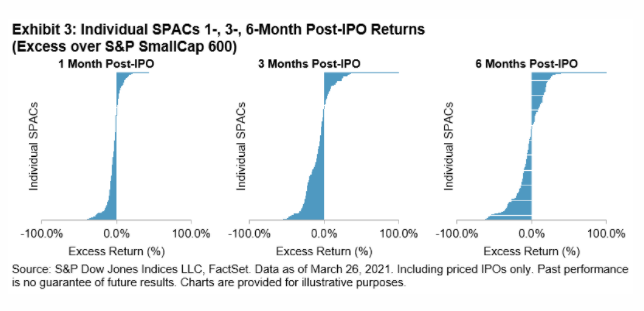
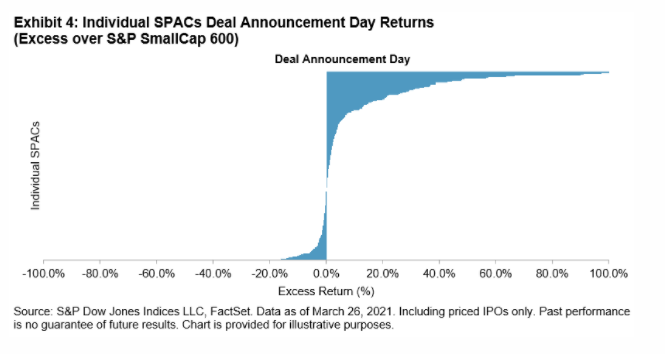
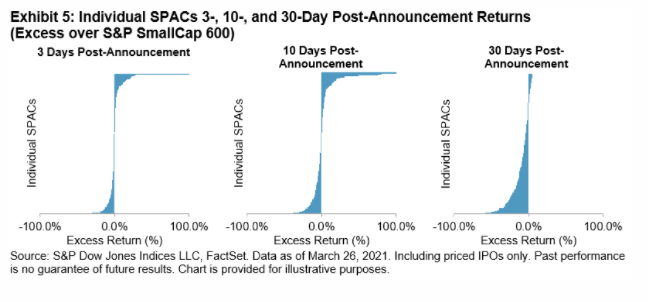
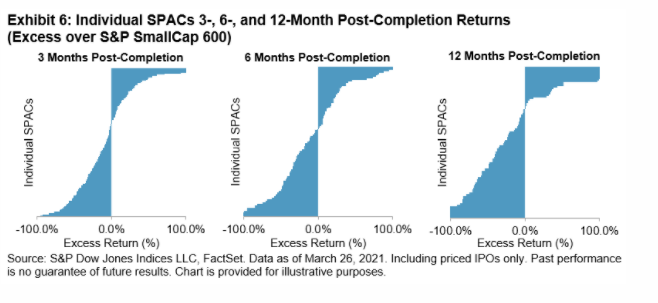
Exhibit 1 summarizes SPACs’ excess return over the S&P SmallCap 600 post-IPO and post-completion. Exhibit 2 shows how daily excess returns changed 30 days before and 30 days after the deal announcement. Finally, Exhibits 3-6 show the distribution of excess returns. The data highlights the following:
- Post-IPO, SPACs underperformed the S&P SmallCap 600 (see Exhibit 1). The distribution of the excess return was heavily skewed (see Exhibit 3).
- SPACs outperformed the S&P SmallCap 600 dramatically upon deal announcement (see Exhibits 2 and 4). Reflecting the market’s general positive sentiment, the percentage of SPACs that outperformed increased toward the deal announcement (see Exhibit 1). The abnormal return observation during the announcement day is consistent with previous research.1
- After the deal announcement, the excess return distribution was pushed to extremes, with large positive and negative excess returns observed. The mean excess return, however, was about 0. Holding SPACs 30 days post-deal announcement, in general, led to underperformance versus the S&P SmallCap 600 (see Exhibit 5).
- Post-deal completion, we observe a heavily skewed distribution of excess returns, with an increasing negative skewness, the further away from completion (see Exhibit 6). This observation is also consistent with previous studies documented that post-merger SPACs are value-destroying to investors.2
We remain cautious in assessing post-merger performance because most SPACs listed in 2020 and 2021 are still looking for targets. As the number of SPACs proliferate, how they perform post-merger will be worth monitoring going forward.
Originally published by Indexology, 4/15/21
1 Rodrigues, U., & Stegemoller, M. (2014). What all-cash companies tell us about IPOs and acquisitions? Journal of Corporate Finance, 29, 111-121.
2 Lakicevic, M., & Vulanovic, M. (2013). A Story on SPACs. Managerial Finance, 39(4), 384-403. Dimitrova, L. (2017). “Perverse incentives of special purpose acquisition companies, the “poor man’s private equity funds.” Journal of Accounting & Economics (JAE), Vol. 63, No.1, 2017. Klausner, Michael D. and Ohlrogge, Michael, A Sober Look at SPACs (October 28, 2020). Stanford Law and Economics Olin Working Paper No. 559, NYU Law and Economics Research Paper No. 20-48
The posts on this blog are opinions, not advice. Please read our Disclaimers.
