

By Matthew J Bartolini, Head of SPDR Americas Research, CFA
- Fixed income and thematic ETFs continued to see strong inflows in October; bond ETFs took in more than $19 billion
- Amid mixed sentiment, equity ETFs posted below-average flows of just $11 billion
It is virtually impossible to author an October monthly commentary prior to the November 2020 US election. The election is a macro risk event akin to a pool game break shot: The path dependences are far too difficult to predict with any absolute certainty. I find it more prudent to discuss economic and societal trends which are impacting portfolios today but are obscured by the election. These topics are likely more impactful over the longer term. Key non-election trends that investors should be aware of include:
1. No one likes beats – The proportions of companies beating earnings-per-share (EPS) and revenue estimates are at record highs so far this earnings season. For S&P 500® Index firms, the figures stand at 86% and 81%, respectively.[1] No one, however, seems to care: Firms that have beat on EPS have seen an average price decrease of 1.7% during the period spanning two days before the earnings release through two days after. This is well below the five-year average 0.9% gain for firms with positive earnings surprises.[2]
A low bar—EPS was expected to decline by 21%[3]—alongside a cloudy outlook and elevated valuations[4] have led investors to reconsider the organic nature of these positive surprises, and contemplate whether they can continue amid a resurgence in COVID-19.
2. Cases are rising – Germany, France, and the UK recently announced renewed lockdowns. When the first lockdowns were announced, major equity benchmarks precipitously declined and economic growth forecasts were slashed. Not surprisingly, as these countries ushered in new lockdown measures, the MSCI ACWI IMI Index had its worst week of performance since March.[5]
Rising case rates will increase volatility. Fiscal stimulus is a tourniquet; it helps but will not solve the problem. Right now, Q2 2021 is the earliest time frame for a broadly available vaccine.[6] As a result, expect more case-related headline-induced volatility, requiring portfolios to have a modicum of defense built into their foundations—especially if the US follows the rest of the word with lockdowns.
3. When, not if, on stimulus – 12 million Americans remain unemployed and economic sentiment has stalled out after an initial rebound—similar to the trend witnessed on a global scale.[7] While US lawmakers could not agree on a stimulus package prior to the election, a deal after the election is more likely. As a result, stocks could witness an initial bump when those plans are released. But, as stated above, this is just a tourniquet. Perhaps the next round of stimulus will be a bridge loan to get us to Q2 2021, but if lockdowns persist, it may not be enough to dampen the new episodic risk regime in which we find ourselves.
4. Asset class distortion – Just as the pandemic has impacted certain societal behaviors, it has also distorted asset class risk/return profiles—especially in fixed income, given the renewed low interest rate environment. In addition, policy responses to the pandemic have been inflationary to asset prices, causing stock market earnings multiples to increase significantly.
Returns, therefore, may be lower in the future but without any commensurate reduction in the risk needed to obtain those returns. As a result, structuring portfolios in and out of the core now requires a more tailored approach in order to meet specific return objectives and ensure portfolios remain properly diversified—no matter who wins the election or what party is in control.
Asset class ETF flows: Bonds continue to lead
Equity ETFs posted inflows of $11.3 billion in October, 37% below the five-year average monthly flow figure of $17.9 billion. Equity flows reflect modest positioning ahead of a systemic risk event. Beneath the headline number, however, distinct positioning is apparent with more tactical instruments. As it has been all year long, given the volatility and dispersion witnessed across the market, investors have preferred searching for alpha through rotations as opposed to strictly obtaining broad-market beta.
Bond ETFs continued to take in assets at an elevated pace, as shown below. The $19.9 billion October figure is 84% above the category’s historical five-year average monthly flow figure of $10.7 billion. The strong flows in October pushed 2020 year-to-date flows to a new annual record, besting the 2019 record of $155 billion. With two months left, the 2020 figure could break the $200 billion mark. In fact, if flows were to match just the five-year average monthly flow figure—less than the $17.4 billion average from 2020—flows for the full year would total $196 billion. A more bullish case—using the 2020 average—would have flows hitting $209 billion.
Bond ETFs continue to be used to position portfolios for an uncertain and low-yielding world. Since the onset of the pandemic, investors have gravitated toward the ETF structure for bond exposure, thanks to the low cost, transparency, market coverage, and liquidity afforded by the vehicle. The flows are partly secular, as more investors gravitate towards the vehicle, but also partly tactical as investors search for ways to buffer equity risk or obtain yield in a precise and efficient manner.

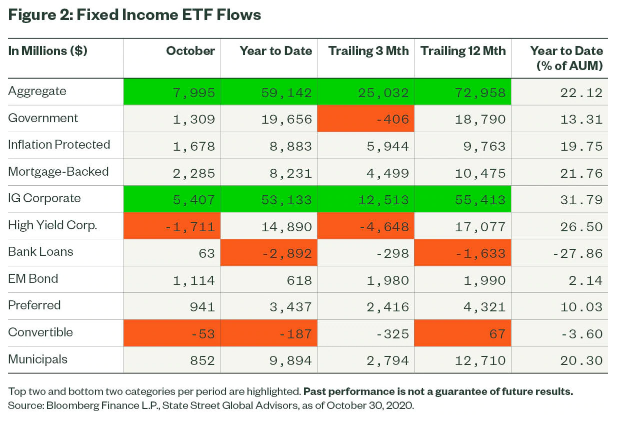
Fixed income ETF flows: Broad-based strength
Nine out of the 11 bond sectors we track posted inflows in October, with six amassing inflows of more than $1 billion, as shown below. The two sectors with outflows were Convertibles and High Yield—both segments with a high degree of equity sensitivity.
Investors sought out emerging market debt as a source of income and in recognition of the region’s improving economic prospects. Flows into Mortgage-Backed ETFs were also notable, as investors sought defensive core bond positions that yield more than the Bloomberg Barclays US Aggregate Bond Index. While third in notional terms, flows into this segment were the largest on a relative basis as the $2.3 billion inflow represents a 5.1% increase over start-of-month assets. Lastly, with stimulus likely occurring no matter who wins the election, investors continued to seek out inflation protected bond strategies.
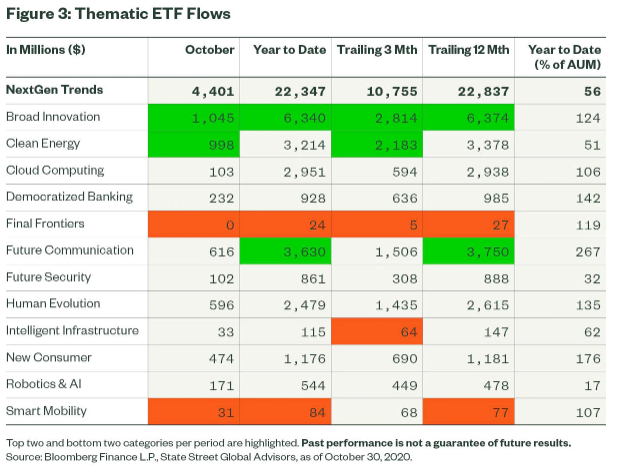
Thematic ETF flows: Investors embrace friendly trends
Funds focused on emerging economic trends took in $4.4 billion last month, raising the year-to-date total for these NextGen Trends funds to more than $22 billion, as shown below. This represents a 56% organic growth rate in assets under management outside of any price appreciation. The October inflow figure is a new monthly record, surpassing the $4.1 billion gathered in August. Assets under management are now approximately $60 billion.
Flows into thematic ETFs focused on NextGen Trends are next-level strong and illustrate how investors have sought out opportunities stemming from the distortive impact of COVID-19 on daily routines and the corresponding inflection point in innovation. In October, inflows were once again led by funds targeting broad-based innovation. Clean Energy, a high-profile debate topic, had the second-highest number of flows this month.
Notably, 76% of thematic ETFs outperformed the S&P 500 in October, beating the index by an average of 3%.[8] Top-performing areas and segments with the deepest breadth of outperforming funds include: Clean Energy, Intelligent Infrastructure, Human Evolution, and Smart Mobility—all areas that may benefit under a Biden-Harris administration, as discussed in our election series. The performance trends in October are a continuation of the 2020 trends: More than 70% of thematic NextGen Trends ETFs are outperforming the S&P 500 this year. The average year-to-date return for thematic ETFs is 22%, versus just 3% for the S&P 500.[9]
Maintaining a code of discipline: Finding balance amid chaos
Election results may create tactical opportunities. Depending on investors’ capital, conviction, and courage, portfolios could be positioned accordingly. However, the long-term economic and humanitarian impacts of 2020 will require investors to exude a level of flexible discipline within portfolios, characterized by an ability to maintain balance amid chaos while not losing sight of any opportunities provided. The environment also requires investors to realize the world has changed—so strategic allocations should be altered or updated in order to meet risk and return targets for the next decade.
For “Star Wars” fans, this is much like how the Mandalorian cares for “the Child” because of his ancestral code. Investors must have a similar code of discipline in our strange times. This is the way.
Originally published by State Street Global Advisors, 11/5/20
1 FactSet as of 10/30/2020
2 FactSet as of 10/30/2020
3 FactSet as of 10/30/2020
4 Bloomberg Finance L.P. as of 10/30/2020; S&P 500 P/E Next-Twelve-Months trades at 23.7761 vs. 30-year average of 17.11
5 Bloomberg Finance L.P. as of 10/30/2020; performance from 10/23/2020 to 10/30/2020 was -5.3%
6 “All-In U.S. Push for Vaccine Raises Risk Virus Lingers”, Bloomberg, 10/27/2020
7 Bloomberg Finance L.P. as of 10/30/2020; Citi US Economic Surprise Index and Citi Global Economic Surprise Index have fallen since July 2020
8 Bloomberg Finance L.P. as of 10/30/2020, based on SPDR Americas Research calculations
9 Bloomberg Finance L.P. as of 10/30/2020, based on SPDR Americas Research calculations
The views expressed in this material are the views of the SPDR Research and Strategy team and are subject to change based on market and other conditions. It should not be considered a solicitation to buy or an offer to sell any security. It does not take into account any investor’s particular investment objectives, strategies, tax status or investment horizon. There is no representation or warranty as to the current accuracy of such information, nor liability for decisions based on such information. Past performance is no guarantee of future results.
Unless otherwise noted, all data and statistical information were obtained from Bloomberg LP and SSGA as of September 30, 2020. Data in tables have been rounded to whole numbers, except for percentages, which have been rounded to the nearest tenth of a percent.
The research and analysis included in this document have been produced by SSGA for its own investment management activities and are made available here incidentally. Information obtained from external sources is believed to be reliable and is as of the date of publication but is subject to change. This information must not be used in any jurisdiction where prohibited by law and must not be used in a way that would be contrary to local law or legislation. No investment advice, tax advice, or legal advice is provided herein.
Investing involves risk including the risk of loss of principal.
Bonds generally present less short-term risk and volatility than stocks, but contain interest rate risk (as interest rates raise, bond prices usually fall); issuer default risk; issuer credit risk; liquidity risk; and inflation risk. These effects are usually pronounced for longer-term securities. Any fixed income security sold or redeemed prior to maturity may be subject to a substantial gain or loss.
Equity securities may fluctuate in value in response to the activities of individual companies and general market and economic conditions.
The whole or any part of this work may not be reproduced, copied or transmitted or any of its contents disclosed to third parties without SSGA, AL’s express written consent.