Equity ETFs have typically dominated the ETF universe in terms of the sheer number of funds and the amount of assets invested in them. The category represents more than three-quarters of the total assets invested in the U.S.-listed ETFs. Unsurprisingly, equity ETFs have dominated fund flows, pulling in nearly $150 billion this year while the entire ETF industry has gained more than $363 billion. Investor interest may have fallen off a bit, but it’s still fairly strong.
Using LOGICLY’s data and analytics platform, this article looks at the top funds in the equity asset class that have brought in the most assets YTD.
Large Equity ETFs Lead Flows
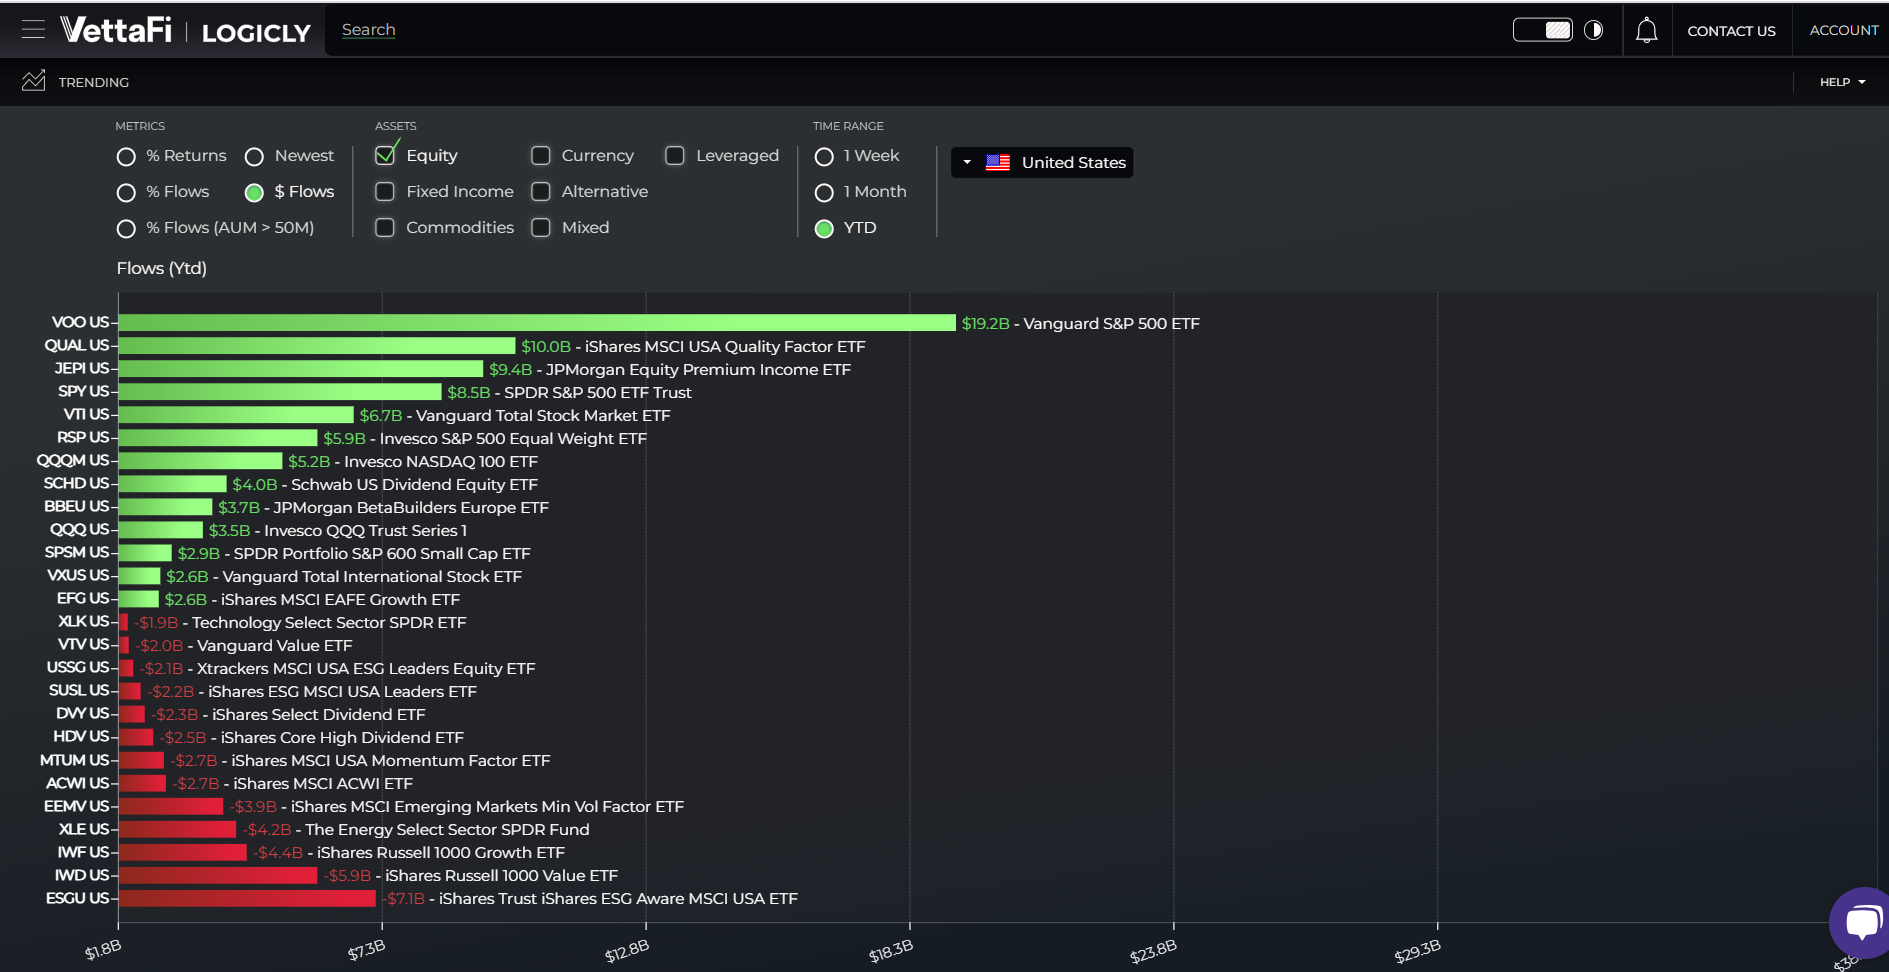
Top flows YTD for equity ETFs, per LOGICLY. Click to enlarge.
There are three equity ETFs that have added at least $9.0 billion in assets so far this year. The $328.3 billion Vanguard S&P 500 ETF (VOO) pulled in just over $19.0 billion in flows YTD, putting it at the top of the flows leaderboard. VOO tracks the S&P 500 Index and includes names like Apple Inc., Microsoft Corporation, and Amazon.com Inc. among its top holdings. The fund also has a low expense ratio of 0.03%. VOO is up 18.53% YTD.
The largest ETF in the world also tracks the S&P 500 Index. The $427.8 billion SPDR S&P 500 ETF Trust (SPY) claimed fourth place for equity ETF inflows with a gain of $8.4 billion year-to-date. The fund is three times more expensive than VOO, with an expense ratio of 0.09%, which could explain why it’s gathering assets more slowly in 2023. It has a similar YTD return to VOO at 18.44%.
Other Top Equity ETFs for Flows
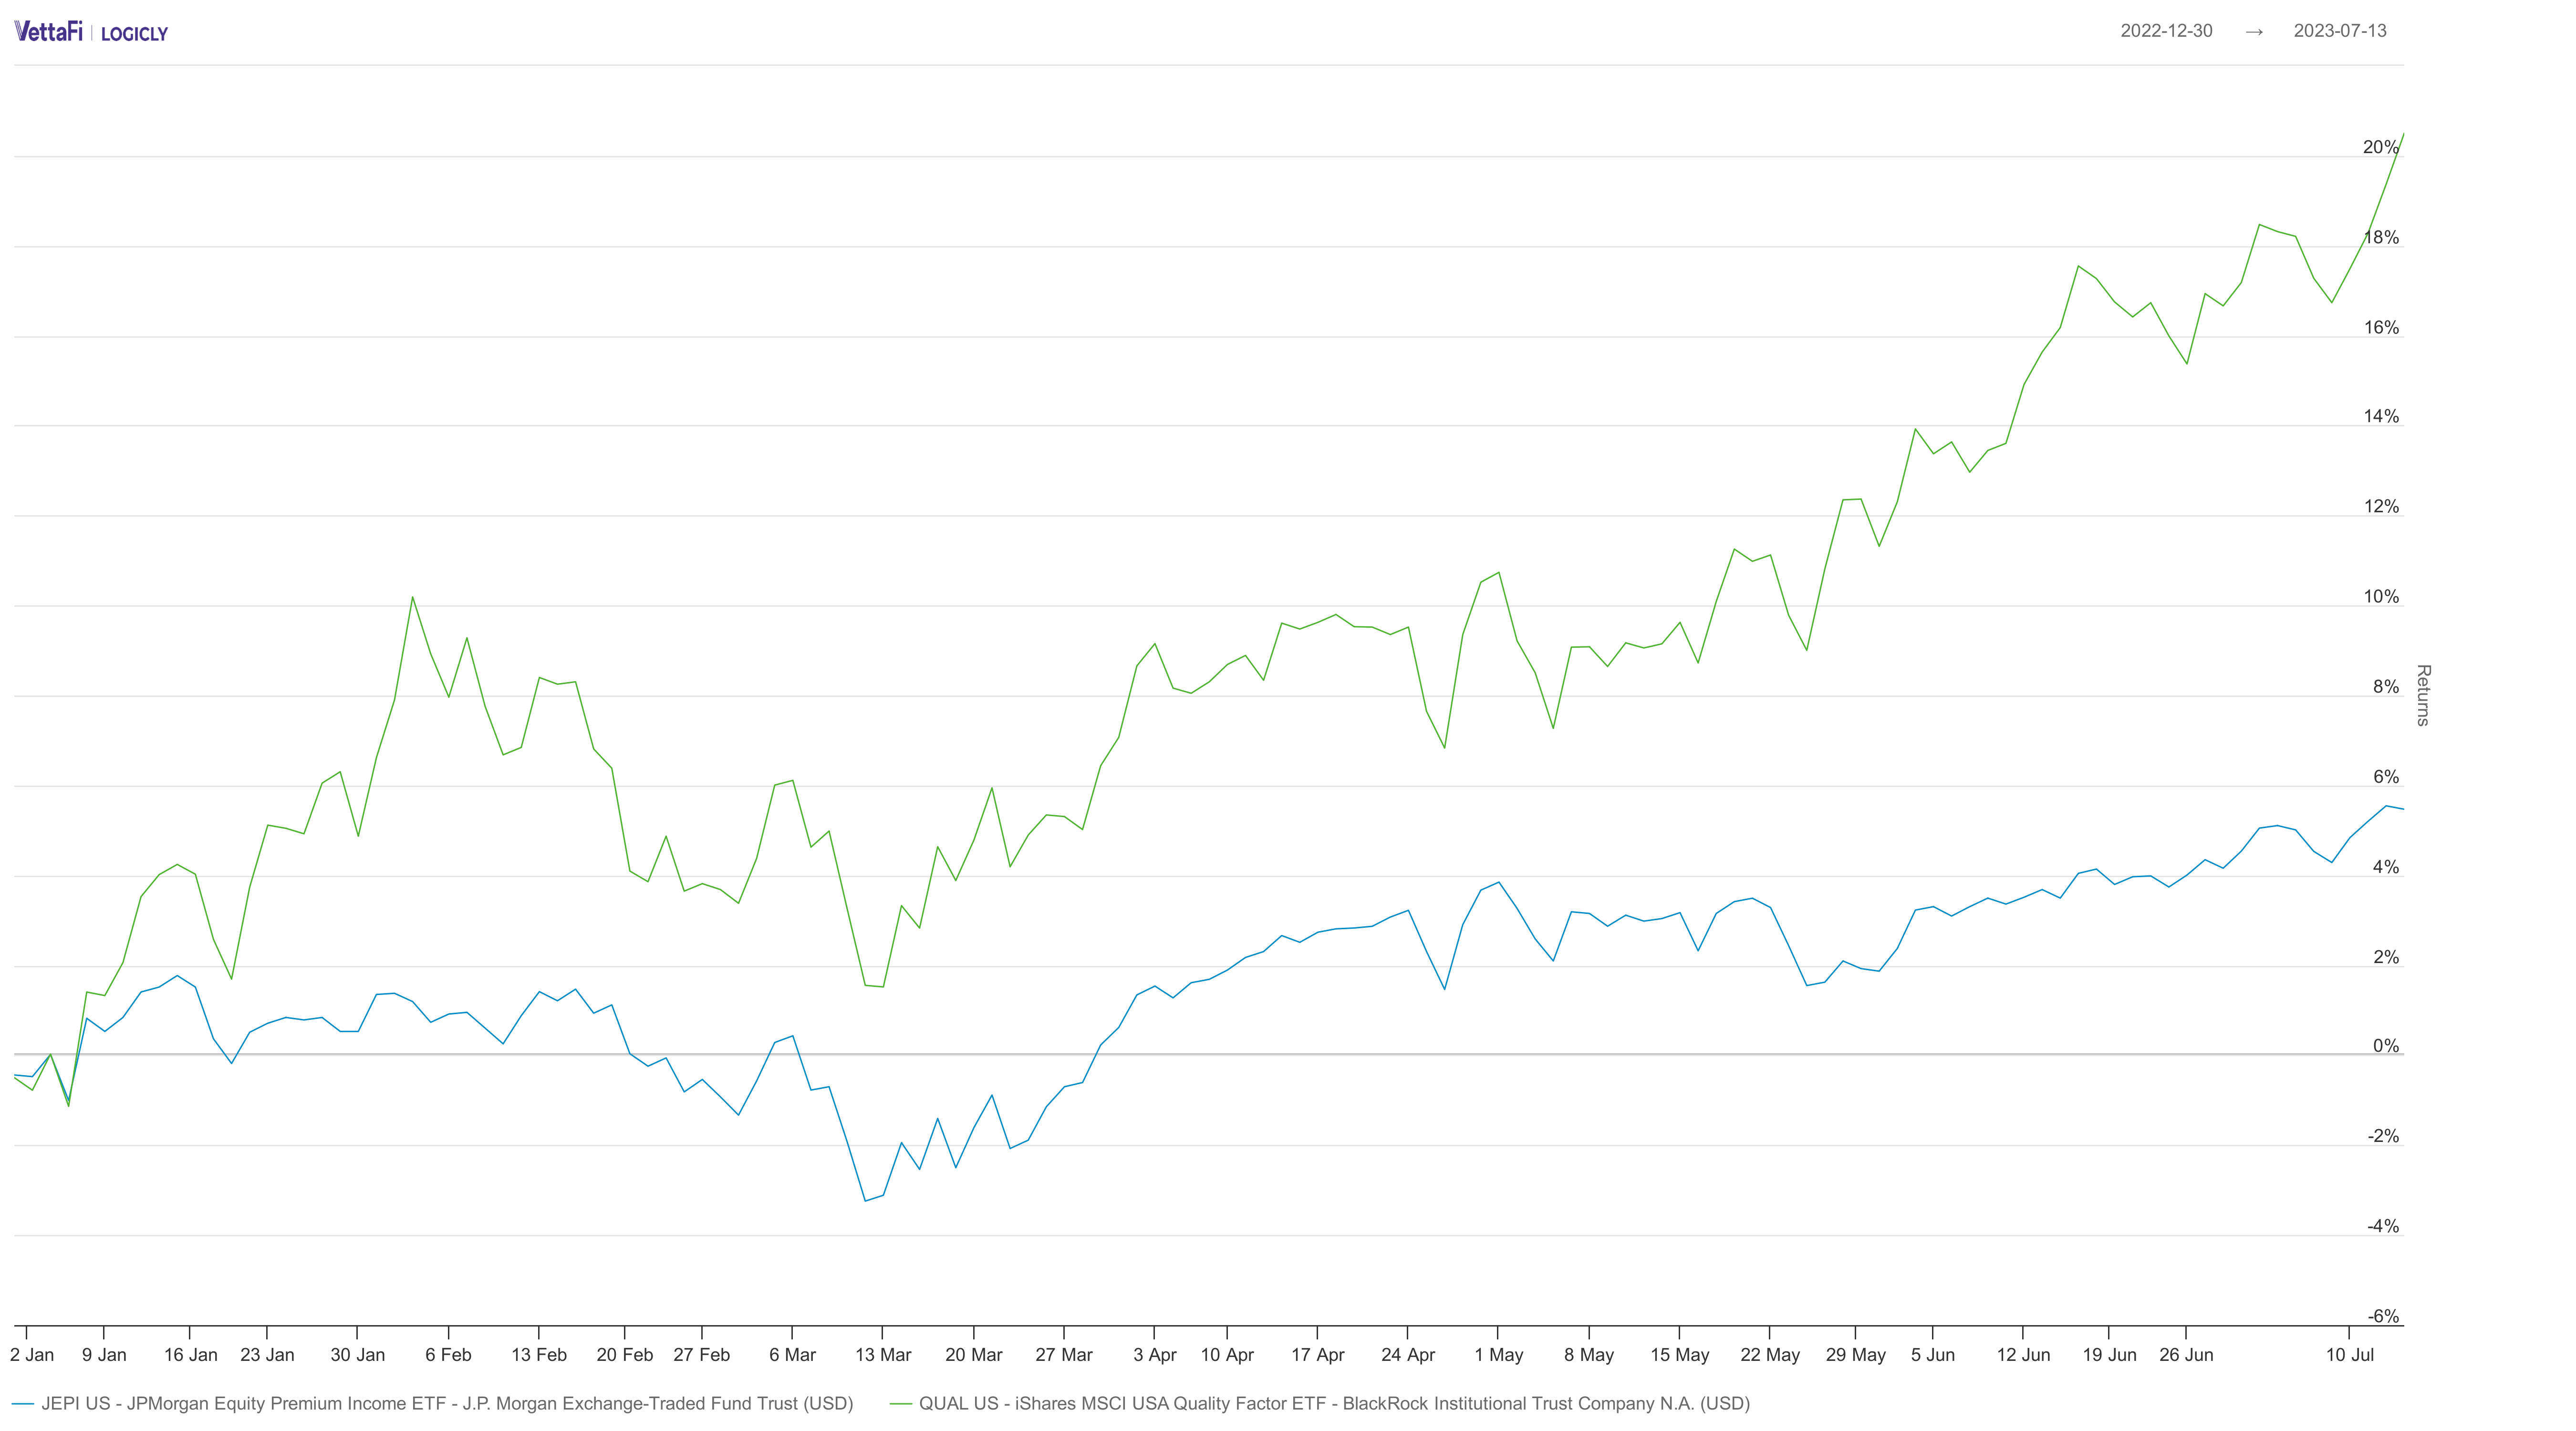
JEPI and QUAL YTD performance, per LOGICLY. Click to enlarge.
The $32.3 billion iShares MSCI USA Quality Factor ETF (QUAL) and the $28 billion JPMorgan Equity Premium Income ETF (JEPI) rank second and third among equity ETFs that have seen the most YTD flows.
QUAL has brought in $10 billion in assets this year. The fund tracks an index that targets the quality factor, taking into account criteria like earnings, growth, and debt-to-equity ratios to select its components. QUAL has more than 100 holdings in its portfolio, with this year’s market darling NVIDIA Corp. representing its largest holding. The fund notched a 21.10% YTD return, outperforming some of the other top equity ETFs for flows.
JEPI has brought in an impressive $9.4 billion this year. Using an actively managed approach, the fund combines exposure to lower-volatility large-cap U.S. stocks with an options overlay that generates income for the portfolio. The fund’s top holdings are currently Adobe Incorporated, Amazon.com Inc., and Microsoft Corporation. The fund has posted a YTD return of just under 6%.
A Broad Market ETF
The Vanguard Total Stock Market ETF (VTI) claims fifth place for equity ETF inflows this year. The fund covers the entire market, making it a great choice for investors looking for diversification. It has more than seven times the number of components that VOO has, and at the same low expense ratio. VTI has also produced a YTD return of 18.5%, essentially matching VOO’s performance.
While investors remain primarily interested in equity ETFs, the funds currently represent a smaller proportion of year-to-date flows than they do of total assets. The significant assets flowing into QUAL and JEPI also suggest that investors may be taking a more conservative view of equity markets, given concerns around inflation and the possibility of recession. VTI’s popularity further supports this argument, given the breadth of its portfolio.
Visualizations and data provided by LOGICLY, which is a wholly owned subsidiary of VettaFi.
For more news, information, and analysis, visit the Equity ETF Channel.