
Prepared by Scott Opsal
Investment styles generally have an inherent tendency to outperform in either bullish or bearish market environments. One cohort attracts buyers when the equity market is running higher and optimism prevails, while other styles draw interest when the market is weak, worry abounds, and safety is the desire of the day. Such a behavioral bias is built into some factors by design, others accrue their directional bias as a secondary result of economic or cyclical forces.
There is no “official list” of bullish or bearish factors, so we must infer these tilts by examining style performance during periods when the market is exhibiting clear signs of bullish or bearish sentiment. The pandemic-induced swings during 2020 were exceptional in their speed and magnitude, providing excellent data points for analyzing style performance during extreme phases of market movements. The year also experienced a third window of acute style performance following Pfizer’s announcement of an effective COVID-19 vaccine, and we examined all three moves in a search for style and factor tendencies. We also studied the 2016-2019 market cycle that provided three additional market swings for consideration.
Style Cycles in 2020
As we review factor and style returns for 2020, it occurs to us that the whole is much less interesting than the sum of its parts. The virus panic of 2020 provided extreme examples of bear and bull moves within a single year, and this year’s round-trip offers an opportunity to test the reliability of style characterizations. The S&P 500 returned 18.4% for 2020, a nice profit that few might have expected in the dark days of March, but not extraordinary in the broad span of market history. However, the swings in factor returns were significantly wider in both directions. We examined the relative price action of styles and factors using prominent ETFs to represent each theme, parsing the comparative performance of styles during the rapid selloff driven by the virus pandemic and the equally rapid recovery fueled by massive fiscal and monetary stimulus. (Note: the words “style” and “factor” have subtle differences in meaning, but because our roster of sample ETFs includes both types we will use these terms interchangeably.)
Chart 1 depicts style performance during the pandemic selloff of February and March on the horizontal axis, matched against the bull rebound from late March to early September on the vertical axis. Looking first at the bear leg from the market’s high point on February 19th through the low of March 23rd (reading right to left), we find just two factors outperforming the S&P 500 on the way down.
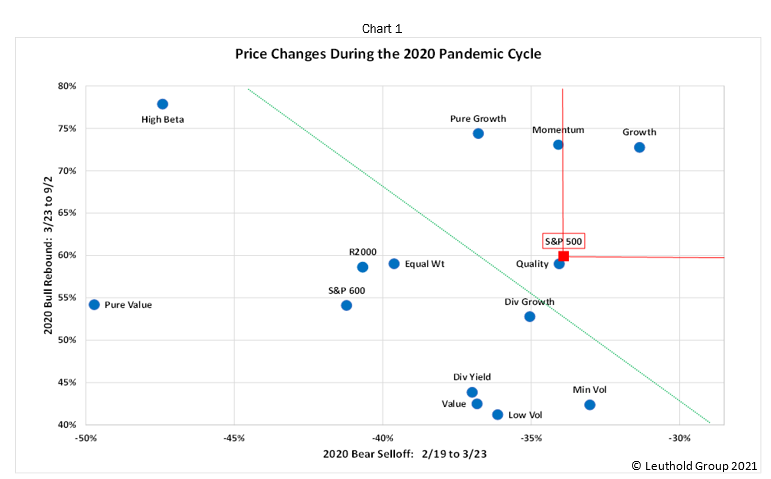
Minimum Volatility makes perfect sense, but Growth was an unexpected leader in the strong down move. It seems that investor enthusiasm for the Social/Mobile/Cloud (SMC) phenomenon was strong enough to carry the day. Not only do these companies provide excellent revenue growth, many of the mega-caps are also wildly profitable and generate huge free cash flows. This combination of sales growth and profitability became the new definition of “safety” during the COVID-19 panic, and SMC companies became a refuge when the severity of the contagion was unknown and economic shutdowns became commonplace.
That only two factors outperformed is a notable and unexpected outcome. Typical risk-on plays such as High Beta, Small Cap, and the Equal Weight S&P sold off hard, as expected. However, several defensively tilted styles also underperformed in a time when we would expect their particular attributes to provide a degree of protection. Dividend and Low Volatility strategies underperformed, and the failure of defensive styles to provide a safe haven in the storm might be the most peculiar aspect of the selloff.
After bottoming on March 23rd, equities began a rebound that carried the market to new highs in September, erasing the effects of the springtime collapse. The vertical axis of Chart 1 shows price performance for the recovery cycle, and we observe that the outperforming styles all come from the roster of typical bull market winners that successfully delivered on their upside potential. Safety and Dividends lagged while Small Caps almost kept up with the S&P 500, which was still being driven by the SMC giants that kept the Growth factor powering higher.
We again note the limited number of styles that outperformed the market during the recovery leg;
Growth (represented by two dots) , High Beta, and Momentum. Consider this for a moment; the S&P 500 outperformed most factors on the way down and on the way back up! This seemingly incongruous result is explained by the fact that Growth is the only style that outperformed the market during both legs of this year’s roller coaster ride. Referring again to Chart 1, the red lines anchored on the S&P 500 square indicate that Growth was the only style that beat the S&P on the way down (right of the red line) and on the way up (above the red line). The Growth style is of such great importance to the S&P 500 that its strength alone was enough to lift the broad market’s performance above most styles and factors in 2020.
Finally, the diagonal green line defines the breakeven points for geometric returns. Styles that land to the upper right had a positive cumulative performance while those to the lower left failed to recover their bear losses over the summer. The S&P 500 landed solidly in the black, accompanied by Growth, Quality, and Momentum. Most styles, however, did not recover their losses by the time the market took a breather in September. We see both defensive themes (Volatility and Dividend strategies) and aggressive themes (High Beta and Small Caps) lagging during the combined cycle.
The Pfizer Vaccine Rally
Style performance took center stage once again on November 9th as Pfizer announced its successful vaccine. This rally has seen IVV’s price jump 8.1% through January 14th, and factor returns are clearly dominated by the bullish, pro-cyclical, risk-on plays. Small Caps, High Beta, and Value have outperformed nicely, reflecting the economic optimism offered by a potential re-opening of the economy at some point this year. Defensive styles trail the S&P 500 by a few percentage points, but the best factor price moves have been more than triple that of the overall market.
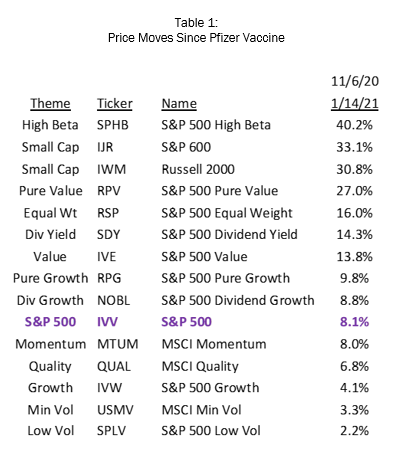
Table 1 also indicates that the S&P 500 has underperformed the majority of styles during the vaccine rotation. Historically, factors have outperformed the Core S&P over time, but of late the strong bias toward Large Growth has hindered the success of factor-based investing. This is one of the few moves in recent years where factors, as a whole, have generated excess returns over the broad market.
The 2016-2019 Cycle
We pick up additional data points for our study by adding the 2016-2019 market cycle. Equities drifted sideways during 2015 before selling off in early 2016. Some would argue that February 2016 marks the beginning of the Growth style’s tremendous surge that carried into 2020, and we use that date to set the first leg of this cycle. The market ran hard into early 2018, then topped out and waffled for eight months until a brisk selloff that bottomed on December 24th. Equities put in a quick low near Christmas 2018 and rallied to new highs before the pandemic hit in February 2020. Chart 2 pairs up the December 2018 selloff with the 2019 rebound that ended with the COVID-19 panic in February 2020.
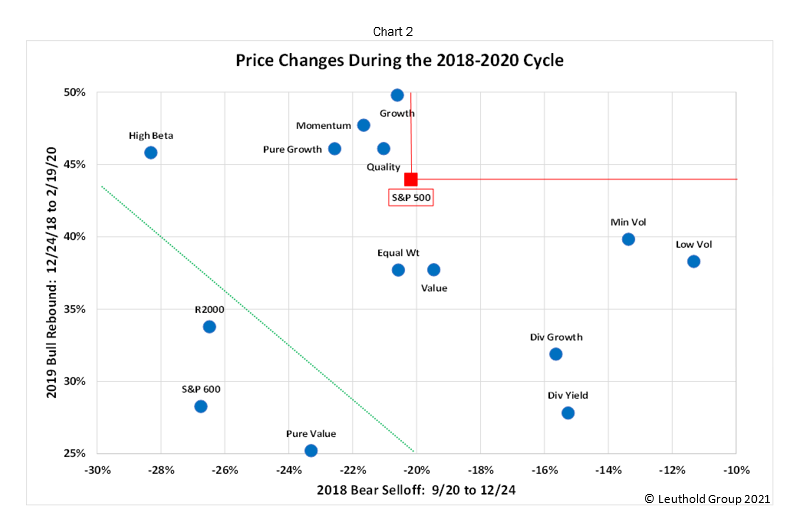
Reading right to left, we find that defensive factors (Dividend and Volatility strategies) provided some shelter during the bear selloff. Small Caps and High Beta trailed, and even Momentum and Growth took a breather from their remarkable runs. Five factors outperformed the S&P 500 with several others just a smidge behind, slotting the broad index near the middle of the pack. It appears that styles and factors behaved as expected during the late 2018 bear decline.
The 2019 advance recouped this selloff and kept roaring ahead, with IVV gaining 44% as the Growth boom regained its strength during those 14 months. Reading from top to bottom, the bullish cohort of Growth, Momentum, and High Beta posted strong gains while the “safe and stable” basket also recovered but was not able to keep up with the broad market. The appropriate, even-handed behavior of styles and factors during this cycle is illustrated by the fact that no dot falls in the upper right quadrant defined by the red lines; that is, no factor outperformed on the way down and on the way back to new highs.
The Broad Picture
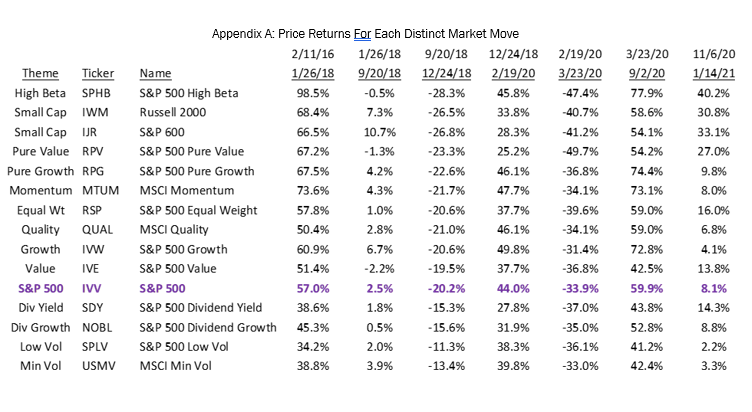
Table 2 consolidates our findings by ranking each style’s price change during six distinct market legs since 2016, excluding windows where the market essentially drifted sideways. The four bull legs in green and the two bear legs in red are averaged in the far-right columns, and the spread denotes the difference in rankings between regimes; a positive spread suggests the style has a bullish tilt while a negative spread suggests a bearish bias. The absolute price moves underlying Table 2 are shown in Appendix A.
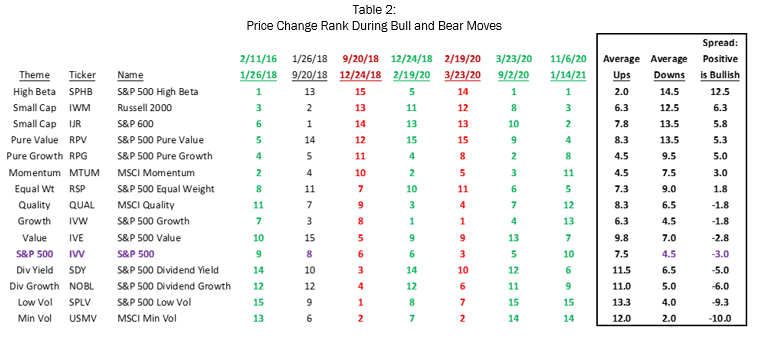
We summarize our conclusions from Table 2 in the following comments, noting factors that have behaved erratically or contrary to their implied temperament, contrasted with those that accurately reflect their underlying nature; that is, factors that ain’t misbehavin’.
High Beta: As expected, the most bullish factor.
Small Caps: The S&P 600 and Russell 2000 are both strongly bullish, but their weak performance in the 2019 bull move was a notable exception.
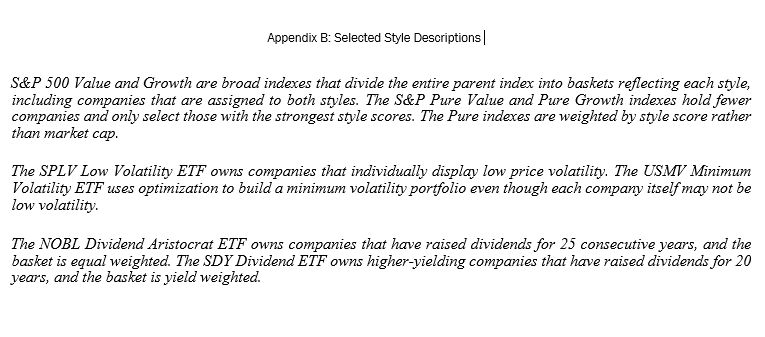
Pure Growth and Pure Value: Strangely, both appear to prosper in stronger markets. Pure Growth has been consistently excellent in up markets, while Pure Value has been more erratic. This unexpected outcome could be the result of the overpowering Growth bias seen in equities since 2016, and/or the result of the particular method S&P uses to construct these “Pure” style indexes. More research is in order here.
Momentum: Scores as a bullish factor, but also ranked well in the pandemic selloff early in 2020. This factor should be neither bullish nor bearish by design, and can perform well as long as the market moves in extended trends. Momentum crashes, where the market reverses quickly, are this style’s Achilles heel. Nevertheless, its five top-5 rankings are best in the field.
Equal Weight S&P: As with Small Caps, this factor tends to be bullish, but because its constituents are the same as the core S&P 500 it experiences more muted swings.
Growth: The overall spread sits near neutral, the result of recently strong performance in any market condition! Growth ranked #1 in the 2019 bull move and also #1 in the pandemic fright of early 2020. We believe Growth’s exceptional performance in recent years, driven by the SMC titans, has overwhelmed the data and makes it difficult to discern its true market cycle preference.
Quality: This presumably “safe” style also scores about neutral, but its two worst rankings are both in up markets. We suspect Quality deserves a defensive moniker, but less so than either Low Volatility or Dividends.
Value: This index represents the conventional definition of S&P 500 Value, and scores better in weak markets. This behavior seems odd, in that Value is often considered a bullish style that benefits from pro -cyclical economic strength and a rising tide that lifts all boats. As with its Growth counterpart, we suspect the recent domination of mega cap growth companies has muddied the signals here.
Dividends: Dividend Yield and Consistent Dividend Growth both have a clear bearish tilt, reflecting the notion that dividends provide an anchor to windward in low-return markets. Dividend Yield performed worse than expected during the pandemic bear market, because many higher-yield companies were also most exposed to the risk of an extended economic shutdown and a severe drop in GDP.
Volatility: Low Volatility and Minimum Volatility strategies rank as the most defensive factors, performing well in down markets but usually bringing up the rear during bull advances. This is by design, and the results are meeting expectations.
Research Takeaways
Investment styles and factors are generally interpreted as having an inherent preference for either bullish or bearish market environments. The theoretical tilt of each style is based on its design and its sensitivity to economic, profit, and valuation cycles. However, theory and practice do not always agree, and we must look to actual performance to confirm our impressions.
Factor sensitivity is best analyzed during extreme market moves, where investor sentiment is easily discernable. The last five years offered several strong up legs dominated by the Large Growth style, interrupted by two bear markets, after going years without a pronounced selloff. Our analysis of clearly defined bull and bear moves over the last five years sheds some light on the cyclical predisposition of each factor and adds to our understanding of the nature of individual styles.
High Beta, Small Caps, Volatility, and Dividends all display a consistent behavior, showing a preference for certain market conditions and performing as we would expect. Momentum, Growth, and Quality consistently outperformed, and we suspect the overwhelming performance of Social/Mobile/Cloud giants during this period has muddied the signal. Recall that the Core S&P 500 Index outperformed the majority of factors in 2020 even though most of the factors themselves are drawn from the S&P 500. Likewise, the performance patterns of Growth and Value are unclear, again likely due to the impact of large growth companies that have obscured the typical market tilts that would otherwise influence returns for the rank-and-file companies included in each style.
Originally published by The Leuthold Group