
Although economic theory would suggest that boosting the size of the balance sheet should depreciate a currency, all else held equal, the pattern on the above chart developed likely because QE raised hopes of stronger growth. Our expectation is that reducing the balance sheet probably won’t matter, but if the pattern is consistent, balance sheet reduction may actually be dollar bearish.
So, we expect the anticipated monetary policy trade of fewer rate hikes for balance sheet shrinkage to be bearish for the dollar.
The second catalyst is policy disappointment from the Trump administration. Earlier this year, we were worried about the dollar’s overvaluation. And, proposed tax cuts and fiscal expansion from the Trump administration would have been dollar bullish, even at lofty valuations.
However, the likelihood of major policy actions have declined and each month that passes without a policy adjustment means that political capital is being lost and it becomes less likely anything will pass. As disappointment grows, we would expect the dollar to retreat.
Related: Fed “Flows of Funds” Data’s Fascinating Economy Insight
Although we retain our secular concerns about the stability and attractiveness of foreign investing in a world here the U.S. is seemingly reducing its hegemonic role, these concerns are overshadowed by the changing dynamics of monetary stimulus. Essentially, the near-term effects of policy and the exchange rate outweigh our secular concerns.
Finally, the issue of recent performance needs to be addressed. Both emerging and foreign developed equity markets have performed very well this year and there is a concern that we may be shifting too late into these asset classes. Although possible, if our expectations of a weaker dollar are accurate, history would suggest a longer period of foreign outperformance.
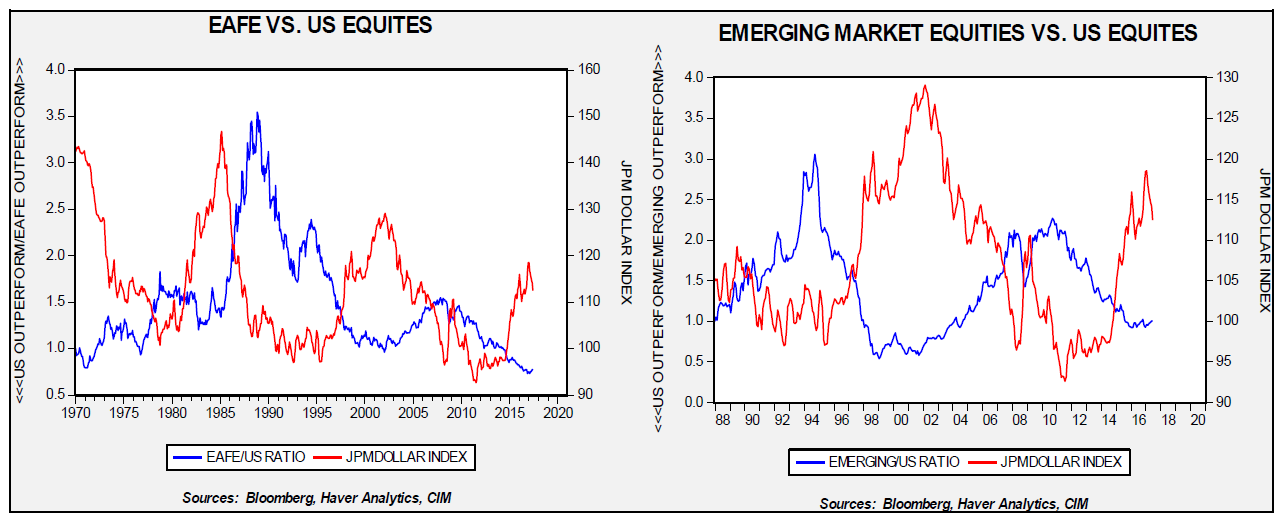
The red line on both charts shows the JP Morgan real dollar index. The blue line on the left chart is the ratio of dollar-denominated EAFE and the S&P; on the right chart, it’s the dollar denominated ratio of emerging markets and the S&P. Both have been rebased to their respective start periods. On both charts, a lower ratio indicates U.S. equity outperformance relative to foreign markets; a rising ratio shows the opposite. In both cases, periods of dollar strength coincide with domestic outperformance. Thus, even with good foreign performance this year, a weaker dollar may result in a longer period of foreign outperformance.
This article is courtesy of Confluence Investment Management, a participant in the ETF Strategist Channel.
Disclosure Information
Past performance is no guarantee of future results. Information provided in this report is for educational and illustrative purposes only and should not be construed as individualized investment advice or a recommendation. The investment or strategy discussed may not be suitable for all investors. Investors must make their own decisions based on their specific investment objectives and financial circumstances. Opinions expressed are current as of the date shown and are subject to change.
This report was prepared by Confluence Investment Management LLC and reflects the current opinion of the authors. It is based upon sources and data believed to be accurate and reliable. Opinions and forward looking statements expressed are subject to change. This is not a solicitation or an offer to buy or sell any security.
