
Investors planning for retirement are facing seven significant challenges: historically high equity valuations; historically low bond yields; increasing longevity and the potential need for expensive long-term care; the failure of government to fully fund the Social Security and Medicare programs; the likelihood of slower economic growth due to the rising debt-to-GDP ratio; and the end (and even likely reversal) of favorable tailwinds for corporate profits (falling interest rates, profits growing faster than GDP, and falling tax rates).
- Historically high equity valuations
From 1926 through June 2023, the S&P 500 provided an annualized (compound) rate of return of 10.2%. With the Consumer Price Index having increased at a rate of 3.0%, the S&P 500 provided a real return of 7.2%. Unfortunately, many investors make the naïve mistake of extrapolating historical returns when estimating future returns. It’s an unfortunate error because some of the returns to stocks in this period were the result of a declining equity risk premium, resulting in higher valuations. Those higher valuations forecast lower future returns.
The best metric we have for estimating future returns is the Shiller CAPE (cyclically adjusted price-to-earnings ratio) 10. As of July 22, 2023, the Shiller CAPE 10 stood at 31.6. The best predictor we have of the real future returns to equities is the inverse of that ratio (the earnings yield, or E/P), producing a forecasted real return of just 3.2% – less than half of the 7.2% historical return. To get an estimate of nominal expected returns, we can add the difference between the yield on the 10-year nominal Treasury bond (which stood at about 3.8% on July 22, 2023) and 10-year TIPS (about 1.5%), about 2.3%. That gives us an expected nominal return to stocks of just 5.5% – about half the historical level.
The forecasts for international returns are better, though also below historical returns. The Shiller CAPE 10 earnings yield for non-U.S. developed markets and emerging markets at the end of June 2023 were 5.6% and 7.3%, respectively. If forecasting nominal returns, 2.3% should be added for expected inflation. Thus, if you have an allocation to international markets, your forecast for returns should be somewhat higher than for a U.S.-only portfolio.
Unfortunately, the bond side of the story is not any better.
- Historically low bond yields
From 1926 through June 2023, the five-year Treasury bond returned 4.9%, 1.1 percentage point higher than the 3.8% yield as of July 22, 2023. Clearly, those relying on historical returns are likely to be disappointed, as the best estimate we have of future bond returns is from the yield curve. Combining the 3.8% expected bond return and the 5.5% expected U.S. equity return in a traditional 60% stocks/40% bonds portfolio, the expected return is about 4.8%. Let’s see how that compares to historical returns.
Over the last 41 years, from 1982 through 2022, a 60% S&P 500/40% five-year Treasury portfolio returned 9.8% a year. The 9.8% return was 1.3 percentage points a year higher than the portfolio’s return over the full 97-year period from 1926 through 2022, which was 8.5%.
Investors building plans based on that 9.8%% return over the last 41 years, or even the 8.5% return covering the last 97 years, are running the great risk that their plans will fail, as the expected return today is just 4.8%.
- Increasing longevity
When I was growing up (I am now 71), there were very few people who lived to collect Social Security for more than a few years. Today, the story is very different. Consider the following: The average remaining life expectancy for a 65-year-old male (female) is now about 18 (21) years. However, those are just averages. The right way to think about longevity risk is to consider that today a healthy male (female) at age 65 has a 50% chance of living beyond the age of 83 (86). And the probability of a 65-year-old man (woman) living to age 97 is 23% (30%). This means that an investment portfolio should have a planning horizon greater than 30 years, assuming the individual is in their mid-60s – while expected returns are much lower than historical returns, portfolios have to last much longer. And it is likely that medical science will continue to advance and extend life expectancy even further, creating the need for more assets.
- Lower growth in corporate profits
A recent whitepaper by the Federal Reserve warned of “significantly lower profit growth and stock returns in the future.” In that paper, “End of an Era: The coming long-run slowdown in corporate profit growth and stock returns,” author Michael Smolyansky explained how the interest rate and corporate tax rate trends for the last 30 years had been a strong tailwind for corporate profits. As a result, stocks performed better than they would have otherwise. Thus, we should not expect repeat performances.
The graph below shows that corporate earnings have grown faster over the last 30 years than in the 40 years before. The robust earnings growth (the rate increased from 7.24% to 7.76%) occurred despite economic growth shrinking markedly (GDP growth fell from 7.63% to 4.68%).

The next chart shows how the effective corporate tax rate has fallen sharply, providing another tail wind to profits.

And as shown in the chart below, earnings growth was also boosted by the increasing use of leverage aided by the lower interest rates on that leverage.
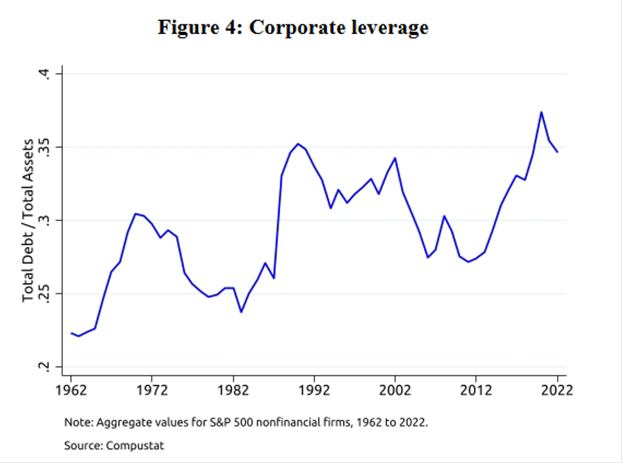
Smolyansky estimated that corporate profits would have grown by 4.50% annually, not 7.76%, without the boost from interest rates and lower taxes and the use of more leverage. The result is that corporate profits as a percentage of GDP has risen from its historical average of about 7% to over 10% today.

In fact, corporate profits peaked at 2.25% in June 2022 and dropped to 10.13% by March 2023 as tight labor markets enabled workers to take a larger share of the GDP, negatively impacting profits. And while lower interest and tax rates boosted growth significantly over the past 41 years, the probability that it will continue is negligible. Given that federal deficits will continue to grow faster than the economy, it is increasingly unlikely that the government can afford to reduce corporate taxes. Thus, the odds favor the raising of corporate tax rates in the future. And while interest rates may fall back to the low levels of the last 10 years, there is little room on the margin for corporations to reduce their effective interest rate meaningfully, especially since many of them took advantage of the low rates to extend maturities.
5. Lower GDP growth due to rising debt
The massive fiscal stimulus in response to the COVID-19 pandemic, producing the largest deficit as a percentage of GDP the U.S. has ever experienced during peacetime, pushed the U.S. debt-to-GDP ratio to in excess of 100%. In addition, large deficits are projected for the foreseeable future, which will lead to further increases in the ratio. And that is even without considering the negative impact of a return to more historical levels of real interest rates. While the average cost of U.S. debt is now about 2%, today interest rates are much higher. If the cost of the debt were to rise to, say, 3.5%, with about $23 trillion of publicly held debt, interest costs would rise to more than $800 billion, or about 3.5% of GDP. And as the budget deficit continues to grow, the debt-to-GDP ratio would keep rising, as the economy is not likely to grow fast enough to reduce it. What’s the impact of a rising debt-to-GDP ratio on economic growth and thus corporate profits, which tend to grow in line with the economy?
Economists have noted several reasons why high levels of debt-to-GDP can adversely impact medium- and long-run economic growth:
- High public debt can negatively affect capital stock accumulation and economic growth via higher long-term interest rates, higher distortionary tax rates and inflation, and by placing future restraints on countercyclical fiscal policies that will be needed to fight the next recession (which may lead to increased volatility and lower growth rates).
- Large increases in the debt-to-GDP ratio could lead to not only much higher taxes (and thus lower future incomes) but also intergenerational inequity.
- Increased government borrowing competes for funds in capital markets, crowding out private investment by raising interest rates. Higher rates, along with higher taxes, increase the cost of capital and thus stifle innovation and productivity, reducing economic growth.
- If the government’s debt trajectory spirals upward persistently, investors may start to question the government’s ability to repay debt and therefore demand even higher interest rates.
- Growing interest payments consume an increasing portion of the federal budget, leaving lesser amounts of public investment for research and development, infrastructure and education.
With that understanding, we turn to a review of the literature on the concerns about the potential for a negative impact on economic growth once debt-to-GDP approaches the level we are now at in the U.S.
The evidence
Veronique de Rugy and Jack Salmon reviewed the literature (24 studies) on the relationship between government debt and economic growth in their 2020 paper, “Debt and Growth: A Decade of Studies.” Their goal was to evaluate the claim that high government debt-to-GDP ratios have negative or significant (or both) effects on the growth rate of an economy. They found that every study but two found a negative relationship between high levels of government debt and economic growth. And most studies found a threshold somewhere between 75% and 100% of GDP. This led them to conclude that the empirical evidence overwhelmingly supports the view that a large amount of government debt has a negative impact on economic growth potential, and in many cases the impact gets more pronounced as debt increases.
In 2021 the Cato Institute also undertook a review of 40 studies published between 2010 and 2020, “The Impact of Public Debt on Economic Growth.” The authors found that “at low debt levels, increases in the debt ratio provide positive economic stimulus in line with conventional Keynesian multipliers.” However, “once the debt ratio reaches heightened levels (nonlinear threshold), further increases in the debt level as a percentage of GDP have a negative impact on economic growth.” In other words, “a nonlinear threshold could suggest that increased government borrowing competes for funds in the nation’s capital markets, which in turn raises interest rates and crowds out private investment, confirming the debt overhang theory.”
With the U.S. debt-to-GDP ratio now more than the thresholds that have historically had a negative impact on economic growth, and with the expectation that the deficits will continue to grow, another headwind is in sight for corporate profits and returns to equity investors.
6. The risks of long-term care
Today, about 17% of Americans are 65 or older. And the longer we live, the greater the risk that we will need expensive medical care. For example, according to the Alzheimer’s Association, about 10.7% of people over the age of 65 have Alzheimer’s disease. The percentage of people with Alzheimer’s dementia increases dramatically with age:
- 5.0% of people aged 65 to 74.
- 13.1% of people aged 75 to 84.
- 33.2% of people aged 85 and older.
7. Failure to fully fund Social Security/Medicare/Medicaid
With declining birth rates in women (from 3.6 children in 1900, to 2.4 in 1950, to about 1.7 today) and longer life expectancy, according to the 2023 Social Security Trustees Report, the Old-Age and Survivors Insurance (OASI) trust fund is projected to be able to pay full benefits until 2033. At that time the fund’s reserves will become depleted and continuing program income will be sufficient to pay 77% of scheduled benefits. Thus, there is at least a risk that benefits will be cut, the eligible age to retire will increase, and an increase in tax rates will be needed.
The situation is similar regarding Medicare. According to the 2023 Medicare Trustees Report, the Hospital Insurance Trust Fund, which funds Part A of Medicare, is projected to be able to pay full benefits until 2031. At that point, the fund’s reserves will become depleted and continuing program income will be sufficient to pay 89% of scheduled benefits. The shortfall will need to be closed through raising revenues, slowing the growth in costs, or most likely both.
Investor takeaways
Seven headwinds are creating risks to the financial plans of investors. While living longer is a good thing, it increases the need for financial assets to support a longer life. And living longer increases the risk of needing expensive long-term care – increasing the need for financial assets. The failure of government to address the underfunding of Social Security, Medicare and Medicaid means that either benefits will be cut or taxes raised. In either case, beneficiaries will be negatively impacted.
Unfortunately, this is occurring at a time when what were once tailwinds for investors (falling interest rates, falling tax rates and rising corporate profits) are likely to turn into headwinds (rising interest costs, rising tax rates, and corporate profits growing at a slower rate than the GDP). In addition, the high and rising debt-to-GDP ratio seems likely to lead to slower economic growth. Slower economic growth and corporate profits growing at a slower pace than the GDP (reversing the trend of the last four decades) are not good for stocks. Should that occur, the likely result will be that investors will no longer be willing to pay an above-average valuation for what will seem like below-average profit growth. This has negative implications for valuations (and future equity returns), particularly for those of growth stocks.
When designing a plan, use current estimates of returns, especially if there have been major changes in stock valuations and bond yields since you last reviewed your plan. A good example of the importance of this lesson was provided by the financial crisis caused by the coronavirus. While the crisis led to a sharp drop in equity prices, it also raised future expected equity returns as valuations fell. The earnings yield on the Shiller CAPE 10 had risen from 3.1% to 4% by the end of March, raising the expected real U.S. equity return by 0.9%. However, the sharp fall in Treasury bond yields lowered the yields on the five- and 20-year Treasury bonds to 0.4% and 1.0%, respectively. While lower valuations on stocks helped, lower yields on bonds hurt.
What can investors do?
Equity investors can increase their expected returns in two ways. They can increase their allocations to international assets, where valuations are much lower and thus expected returns much higher. While the Shiller CAPE 10 earnings yield is 3.2%, it is 5.6% for the international developed markets and 7.3% for emerging markets.
Another way to address the issue is to shift equity allocations from broad-market indices to small-value stocks, which have over the long term provided higher returns and which have valuations that are trading at historically low levels relative to the large stocks that dominate broad market indices. For example, as of June 30, 2023, while Vanguard’s U.S. Total Stock Market Fund (VTSMX) had a P/E ratio of 19.3, Dimensional’s U.S. Small-Cap Value Fund (DFSVX) had a P/E of just 8.9, its International Small-Cap Value Fund (DISVX) had a P/E of just 7.8, and its Emerging Markets Value Fund (DFEVX) had a P/E of just 7.6. The Avantis funds in the same asset classes (AVUV, AVDV and AVES) had similarly low P/Es (8.7, 7.8 and 7.8, respectively).
Another way to address the risks is to diversify your exposure to risk assets to include other sources of risk that historically have had low to no correlation with the economic cycle risk of stocks and/or the inflation risk of traditional bonds and have provided significant risk premiums. The following are alternative assets that are expected to provide diversification benefits and currently have significantly higher expected returns than the S&P 500. With that said, alternative funds carry their own risks; therefore, speak to your financial professional about your own circumstances prior to making any adjustments to your portfolio.
Reinsurance. The asset class looks attractive, as losses in recent years have led to dramatic increases in premiums, and terms (such as deductibles) have become more favorable (reducing risks). Funds that might be considered are SHRIX, SRRIX and XILSX.
Private middle market lending (specifically senior, secured, sponsored corporate debt). This asset class also looks attractive, as base lending rates have risen sharply, credit spreads have widened, lender terms have been enhanced (upfront fees have gone up), and credit standards have tightened (stronger covenants). A fund that might be considered is CCLFX (current yield of about 11% and no duration risk, as all loans have floating rates).
Larry Swedroe is head of financial and economic research for Buckingham Wealth Partners.
Originally published by Advisor Perspectives on August 7, 2023.
For more news, information, and analysis, visit the Core Strategies Channel.
For informational and educational purposes only and should not be construed specific investment, accounting, legal, or tax advice. Certain information is based on third-party data and may become outdated or otherwise superseded without notice. Third party information is deemed to be reliable, but its accuracy and completeness cannot be guaranteed. Indices are not available for direct investment. Their performance does not reflect the expenses associated with the management of an actual portfolio nor do indices represent results of actual trading. Information from sources deemed reliable, but its accuracy cannot be guaranteed. Performance is historical and does not guarantee future results. All investments involve risk, including loss of principal. Mentions of specific securities are only for informational purposes and should not be construed as a recommendation. Individuals should speak with a qualified professional based on his or her circumstances prior to making a change in a portfolio. By clicking on any of the links above, you acknowledge that they are solely for your convenience, and do not necessarily imply any affiliations, sponsorships, endorsements or representations whatsoever by us regarding third-party websites. We are not responsible for the content, availability or privacy policies of these sites, and shall not be responsible or liable for any information, opinions, advice, products or services available on or through them. Neither the Securities and Exchange Commission (SEC) nor any other federal or state agency have approved, determined the accuracy, or confirmed adequacy of this article. LSR-23-540.