
“Enlightened thinkers know that their thoughts form their world and the quality of one’s life comes down to the richness of one’s thoughts. If you want to live a more peaceful, meaningful life, you must think more peaceful, meaningful thoughts.”
Robin Sharma, The Monk Who Sold His Ferrari
The View from 30,000 feet
The U.S. equity markets have been propelled higher in 2023 based on the confluence of drivers:
- Labor market strength and wage increases boosting spending
- Pandemic related cash balances continuing to fortify consumers and companies
- Consistent dissipation of headline inflationary pressures due to falling commodity costs and goods demand normalizing
- Less hawkish monetary policy as approaching the terminal level of rates (reference to Powell’s, Speed, Level and Time explanation)
- Corporate earnings holding up better than expected due to nominal spending and pricing power
- The housing markets showing signs of resiliency despite crippling affordability
- A frenzy around AI stocks reminiscent of the dotcom boom and FOMO as a driver of retail buying and institutional catch up
This healthy cocktail has made for markets that have flown in the face of bears and boosted the S&P500 over 15% this year. The over arching question for the second half of this year is, will these trends continue? Or, will the chorus of leading indicators that drove Bloomberg Economics to forecast a 92% probability of a recession in the first half of the year amount to a more difficult market going forward?
- Negativity in January was pervasive, what’s changed?
- Where is the disinflation in the economy and can it continue?
- The bifurcation of the U.S. housing market
- The most Frequently Asked Question from clients this week: Where are the best places to add risk to the portfolio?
Negativity in January was pervasive, what’s changed?
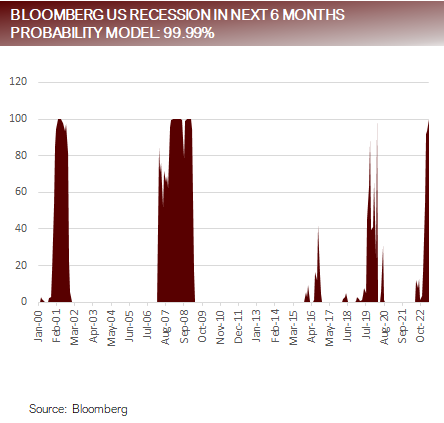
- The Bloomberg Economics U.S. Recession Probability Model indicated that the chances of a recession in the next six months at the end of December 2022 were 92%, and has since been revised at its most recent reading to 99%.
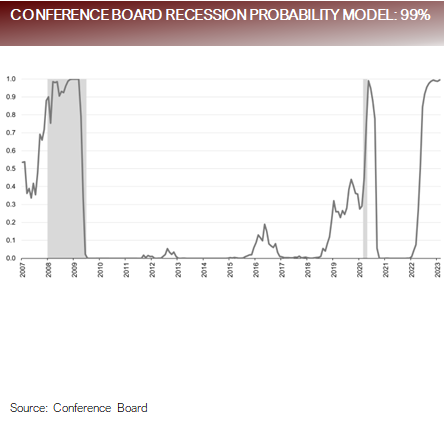
- Similarly, in December the Conference Board economist published a that their probability of a recession in the next 12 months was 99%.
- What’s changed:
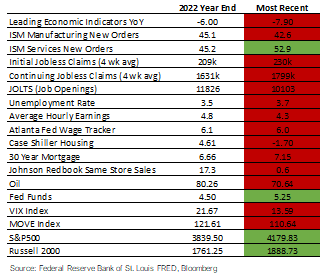
- Bottom Line
- The table says it all, the majority of economic data has continued to deteriorate. However, spending has held up and the markets have been propelled higher.
Recession probability models have worsened as poor data continues to roll in
Where is the disinflation in the economy and can it continue?
Looking at the three major segments of inflation as delineated by the Fed:
- Goods
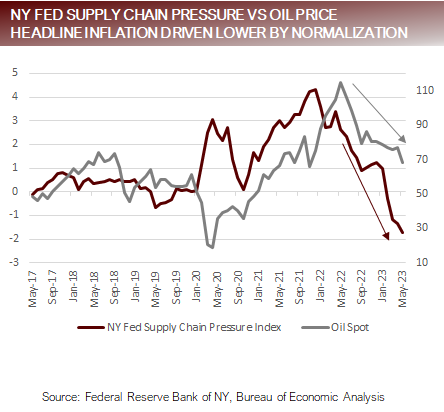
- Falling commodity prices and repaired supply chains have helped reduce cost pressures.
- Consumer demand has normalized creating a disinflationary force.
- Housing
- The slowdown in existing home sales and increased rental supply is pressuring markets lower.
- New home sales have responded with lower price points and mortgage buy downs to buoy market.
- Services Ex-Housing
- The labor market has begun to show signs of weakness with rising claims, falling overtime hours, fewer temp workers, less job openings and less hours worked.
- Wage pressures are still elevated because the 55+ workers have not come back from the pandemic, while prime age worker participation is above pre-pandemic workers.
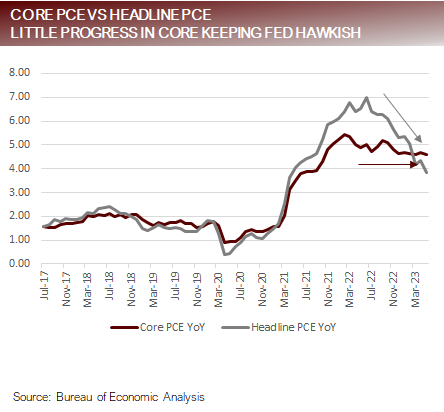
- The Fed continues with hawkish rhetoric because of the strength in the labor market and wage pressures. There will likely be continued disinflationary pressures in Goods and Housing.
Headline PCE driven lower by falling energy costs and healing supply chains
The bifurcation of the U.S. housing market
- The US housing market has split into two segments with differing dynamics and price action.
- New Homes
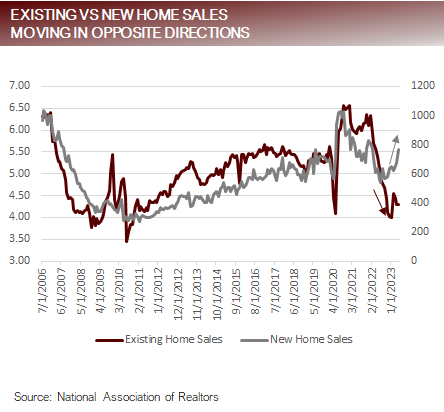
- New Home Sales have skyrocketed back to 2021 levels, well above pre-pandemic norms.
- The Monthly Supply of New Homes is below its peak seen in 2022 and hovering in the highs seen in the decade post the 2008 housing crisis.
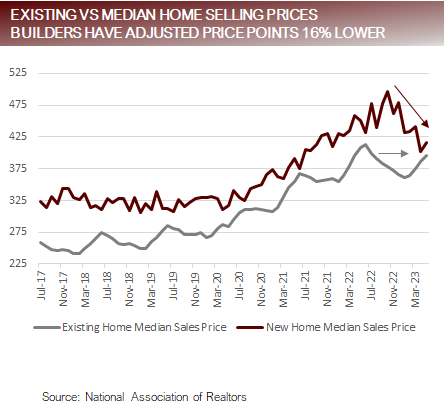
- The New Home Median Sales Price has fallen from a peak of 496k to 416k, down -2%.
- Existing Homes
- After dropping below the pandemic lows in January, Existing Home Sales have begun to creep higher but are still near the lows of the 2008 housing crisis.
- Existing Home Inventory continues to hover around the lows of the pandemic and are now a fraction of what was seen during the 2008 housing crisis.
- The Existing Home Median Sales Price has falling from a peak of 414k to 396k, down -4.2%
- Bottom Line
- The strength in the housing market is concentrated in the New Homes segment, where falling materials costs and the ability to adjust price points, along with flexible mortgage buy down programs have provided support to home buyers. The existing home market has seen a slowdown in volumes because homeowners are locked in low rates are reluctant to move.
The housing market has separated like oil and water – existing and new homes on different paths
FAQ: Where are the best places to add risk to the portfolio?
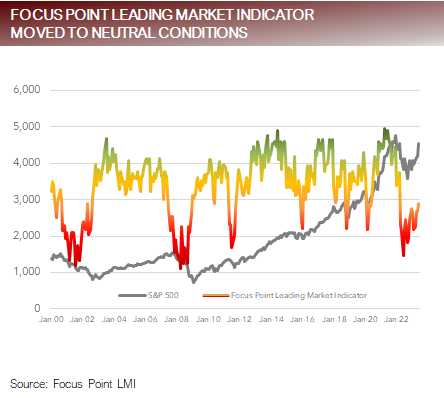
- The Focus Point Leading Market Indicator migrated into Neutral Conditions at the end of June, opening the door to add Many Street models as strategists and firms across Wall Street have also been adding upgrading their market outlooks over the last four to six weeks.
- The LMI had been lingering at the top end of Negative Conditions for the last two months and finally edged higher due to a broadening out of the rally helping market breadth and technical conditions, an improvement in credit spreads, increased demand for housing and an uptick in confidence.
- This leaves strategists and portfolio managers searching for the most prudent way to increase risk, confronted with both improving data, as well as a chorus of indicators that have traditionally signaled a recession is near.
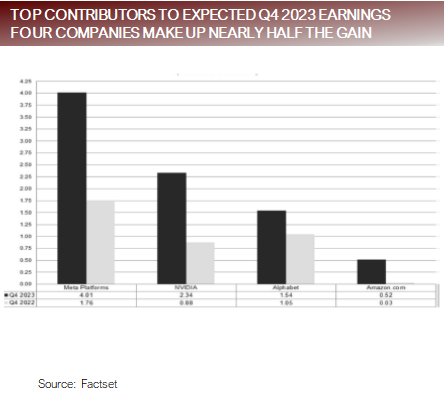
- We believe the most prudent way to increase risk is to look to the companies and sectors with the largest expected earnings growth and cash flow in the S&P500, which can be found in the mega caps. This strategy is not for the faint of heart because earnings estimates around the time of recessions have the nasty habit of being revised However, if the earnings were to hold up, the mega caps, specifically, Amazon, Meta and NVIDIA are expected to report year-over-year earnings growth of more than 100% in Q4 2023. In addition, these three companies have all seen earnings estimates being revised higher since the end of 2022 and together account for nearly half of the estimated earnings growth of the S&P500 for Q4 2023.
Market conditions upgraded with expected growth to be dominated by largest stocks
Putting it all together
- It’s been a complicated year for active managers.
- At the end of 2022 the overwhelming consensus was a recession in the first half of 2023. In hindsight, the negative headlines on this topic probably did a lot to dent consumer and business confidence, which created a feedback loop for negative outlooks becoming pervasive.
-
- Since then, leading measures of economic data have mostly deteriorated, and the broader equity markets have shown little forward progress until June, while the mega caps have surged.
-
- Both the bears, who predicted the economy to deteriorate, and the bulls who predicted resilience, have data or markets to point to that justify their At the end of the day, performance is the determinant that matters, and the bulls win there.
-
- Perhaps the bears are correct, but there’s an old market adage – What do you call the right trade executed too early? Wrong.
- Now the bears, who still point to leading data showing signs of a looming recession, have been forced to postpone their recession call to 2024 and search for the most prudent places to take risk while waiting out the coming storm.
- With over half of the expected earnings of the S&P500 concentrated in the mega caps, this will likely force more money in the direction of the largest names and provide support for the index.
For more news, information, and analysis, visit the Core Strategies Channel.
