

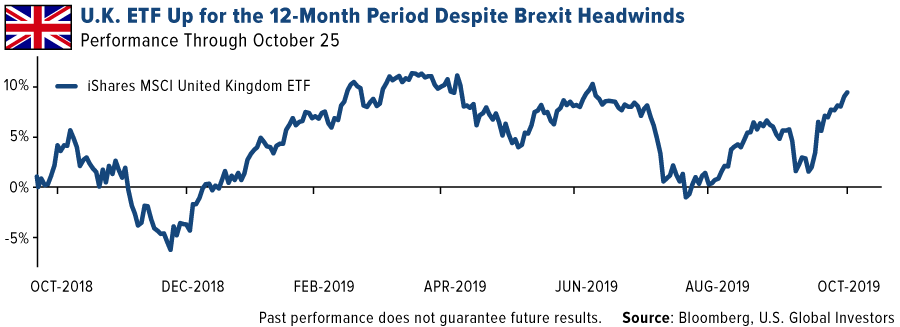
Or consider British stocks. You might think that Brexit uncertainty has made investing in the U.K. a nightmare. And yet the opposite seems to be the case—the iShares MSCI United Kingdom ETF is up close to 10 percent for the 12-month period.
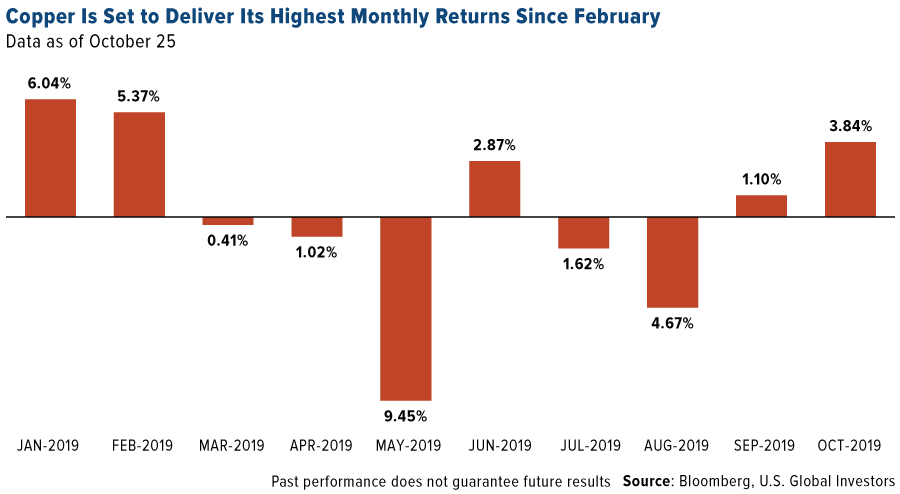
Another good example are the recent copper strikes in Chile. In this case, bad news is actually good news. With production halted for days at Chuquicamata, the world’s largest open pit copper mine by volume, global supply could be disrupted, which may push up prices. Due in part to the strikes, copper is on track for its second straight month of positive gains and its best month since February.
Keeping an Eye on the PMI
Again, one of our favorite leading indicators is the manufacturing purchasing manager’s index, or PMI. The gauge compiles data from thousands of factories and manufacturers across the globe, measuring data points such as output, new orders and employment. At the beginning of every month, we get a number that reflects the health of the industry.
The higher the number is above 50.0, the faster factories are expanding their business. The lower the number is under 50.0, the faster they’re shrinking.
September’s PMI was 49.7. That’s in contractionary mode, but because it’s up slightly from August’s 49.5, factories are pulling back at a slower rate.
We won’t know what the PMI is for October until later this week, but if it shows that we’re back to a neutral 50.0 (or better), it could mean good things going forward for energy and commodities.
According to our own research going back 10 years, when the global manufacturing PMI rose above its three-month moving average, commodities and commodity stocks appreciated six months later. Copper, for instance, gained an average of around 10 percent, with a 71 percent probability of occurrence. West Texas Intermediate (WTI) oil returned about 5 percent. And so on.

Conversely, when the PMI fell below its three-month moving average, materials historically declined—or, in the case of energy, was essentially flat—six months later.
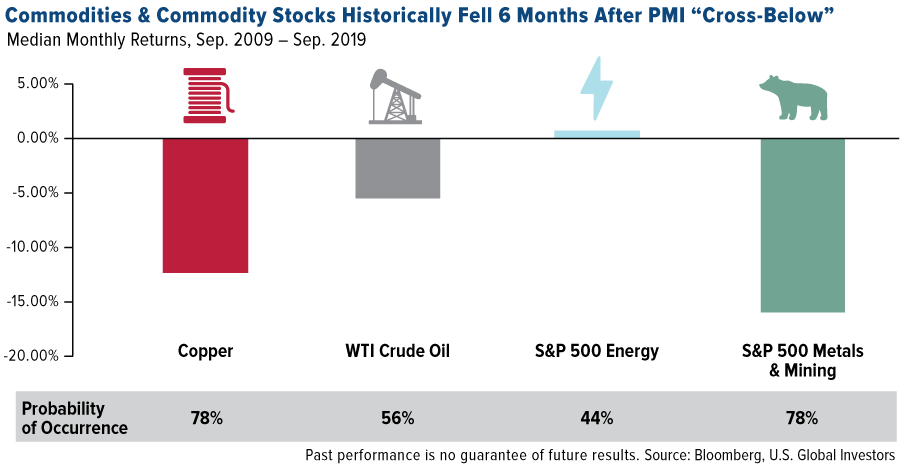
Again, these results are based on 10 years’ worth of data. We’re hoping for a stronger PMI for the month of October, which would help give commodity prices and mining stocks an extra shot of momentum going forward.
This is Your Last Chance to Register!
I want to remind you that time is running out to register for our upcoming gold webcast! On October 31, I’ll be joined by mining legend Pierre Lassonde, who shocked CEOs and analysts at this year’s Denver Gold Forum by forecasting $25,000 gold by 2049. I’ve participated in dozens of webcasts over the years, and trust me, this is one you won’t want to miss!
To reserve your seat, email us today at [email protected]!
The Purchasing Manager’s Index is an indicator of the economic health of the manufacturing sector. The PMI index is based on five major indicators: new orders, inventory levels, production, supplier deliveries and the employment environment. The Consumer Confidence Index (CCI) is an indicator which measures consumer confidence in the Economy.
The S&P 500 Stock Index is a widely recognized capitalization-weighted index of 500 common stock prices in U.S. companies. The S&P 500 Energy comprises those companies included in the S&P 500 that are classified as members of the GICS energy sector. The S&P Metals & Mining Select Industry Index represents the metals and mining sub-industry portion of the S&P Total Market Index.
Holdings may change daily. Holdings are reported as of the most recent quarter-end. None of the securities mentioned in the article were held by any accounts managed by U.S. Global Investors as of 9/30/2019.