
The Long-Term Appeal of Companies That Consistently Increase Dividends
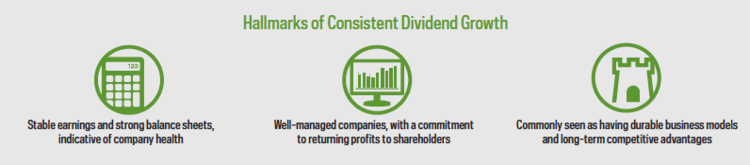
Companies that consistently grow their dividends, year after year, have become especially popular with investors in recent years. Generally, these high-quality companies have displayed durable business models, stable earnings, solid fundamentals, and strong histories of profit and growth. As a result, strategies featuring companies with consistent dividend growth have exhibited strong performance characteristics under a wide range of market conditions.
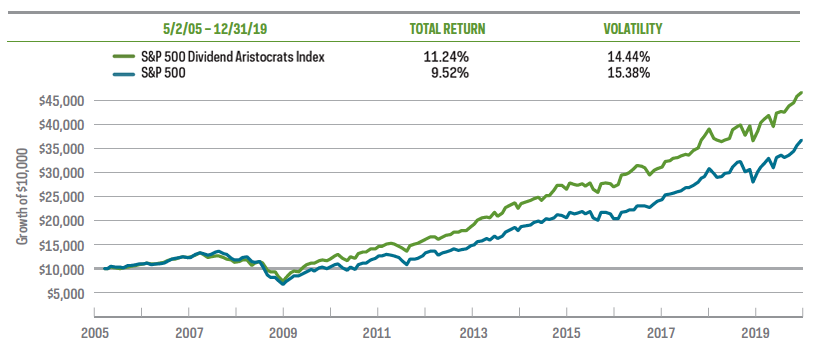
Consistent Dividend Growth Strategies Have Outperformed, with Less Volatility
Investment strategies focused on consistent dividend growth have generally outperformed their benchmarks over the long term. For example, one of the most widely followed dividend growth strategies is the S&P 500® Dividend Aristocrats® Index, which focuses on companies with at least 25 years of uninterrupted dividend growth. Since its inception, the index has outperformed the S&P 500 with lower volatility.
Sources: ProShares, S&P Dow Jones Indices, Bloomberg, Morningstar, Kiplinger, “The Long-Term Allure of Dividends,” May 2019. NOBL performance from 10/9/13 (inception) to 12/31/19: NAV 27.45% one-year, 10.86% five-year, 12.98% since inception; Market Price 27.40% one-year, 10.83% five-year, 12.97% since inception. NOBL’s total operating expenses are 0.35%. Performance quoted represents past performance and does not guarantee future results. Investment return and principal value will fluctuate so that an investor’s shares, when sold or redeemed, may be worth more or less than the original cost. Current performance may be lower or higher than the performance quoted. Performance data current to the most recent month-end may be obtained at ProShares.com.
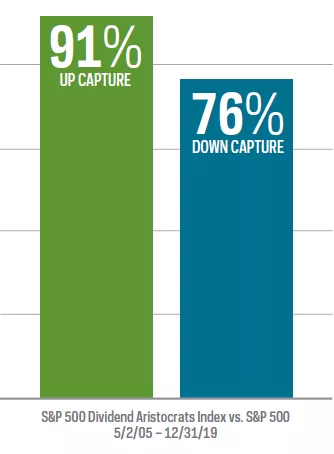
Consistent Dividend Growers Have Captured More of the Market’s Gain, with Less of the Loss
One way to evaluate how an investment strategy performs is to look at its up/down capture ratio—how it performs in both rising and falling markets over time. Strategies focused on consistent dividend growth have typically displayed highly favorable up/down capture ratios.
For investors, that means the opportunity to participate in the long-term growth of the markets—but importantly, it also means the potential to retain more value when markets inevitably decline.
Since its inception, the S&P 500 Dividend Aristocrats Index has captured 91% of the market’s gains, while experiencing just 76% of the market’s losses—contributing to the long-term outperformance of the strategy.
“Up capture” measures fund or index performance relative to a benchmark when it has risen. Likewise, “down capture” measures performance when that benchmark has declined. Ratios are calculated by dividing monthly returns for the fund or index by the monthly returns of the benchmark during the stated period and multiplying that factor by 100.
More Than Just Consistent—the Best Dividend Growers
Not all dividend growth strategies are equal—our funds invest in the best dividend growers, companies with the longest track records of dividend growth in their market segments. Other strategies may only screen for companies that grow their dividends from one year to the next. ProShares Dividend Growth ETFs and the indexes they follow, however, set a higher standard for consistency. For example, just 64 companies in the S&P 500—only 13%—currently meet the requirements of the S&P 500 Dividend Aristocrats Index. Many of them are household names recognized all over the world for their quality characteristics, investment potential and staying power.
Not only are these companies rare, but their commitment to consistent dividend growth is remarkable. Among the S&P 500 Dividend Aristocrats, more than half of its companies have over 40 consecutive years of dividend growth, and 10 of them have grown their dividends for more than half a century. To see a complete list of current companies in the index, visit ProShares.com.

Source: S&P Dow Jones, as of 2/3/20. Historical dividend growth not recorded by S&P before 1962; companies with 57 years may have longer records.
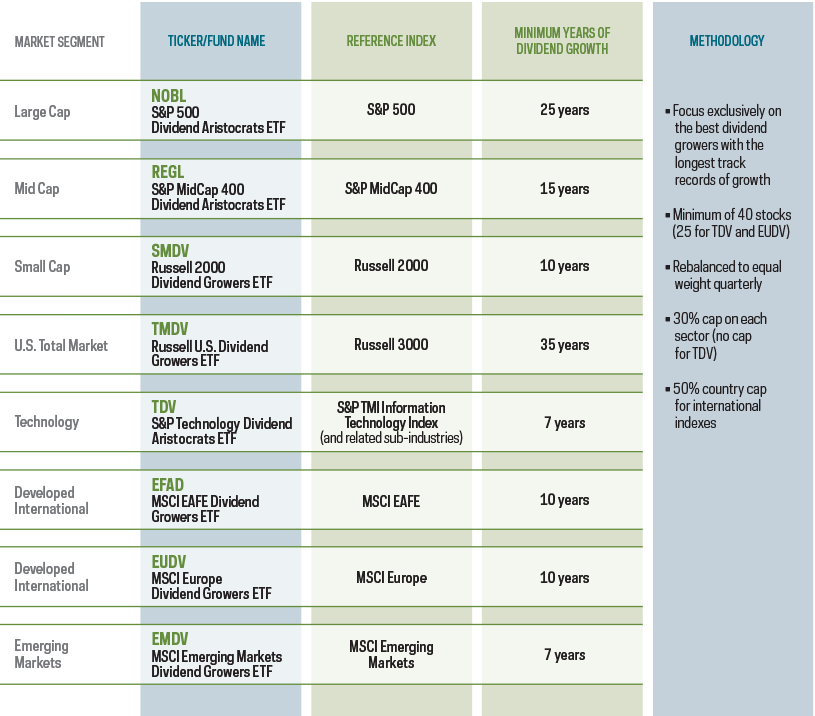
ProShares Offers the Largest Lineup of Dividend Growth ETFs
Strategies focused on companies with the longest records of consistent dividend growth can help investors build durable portfolios that may perform well in both strong and turbulent markets. And ProShares offers more dividend growth ETFs than any other company.
Our $6 billion flagship fund, NOBL, is the only ETF that invests exclusively in the high-quality names of the S&P 500 Dividend Aristocrats Index. NOBL is the crown jewel in ProShares’ royal family of eight ETFs designed to enable diverse dividend growth allocations across an array of geographies and market segments. Visit ProShares.com to learn more about ProShares Dividend Growth ETFs.
If fewer than the minimum required number of stocks meet criteria, the strategies may include companies with shorter dividend growth histories.
ABOUT PROSHARES
ProShares has been at the forefront of the ETF revolution since 2006. ProShares now offers one of the largest lineups of ETFs, with more than $35 billion in assets. The company is the leader in strategies such as dividend growth, interest rate hedged bond and geared (leveraged and inverse) ETF investing. ProShares continues to innovate with products that provide strategic and tactical opportunities for investors to manage risk and enhance returns.
Find out more
Visit ProShares.com or consult your financial advisor.
Click here to download a PDF version of this report.
As of 2/3/20, weights for NOBL holdings with greater than 50 consecutive years of dividend growth are: 3M 1.56%, Coca-Cola 1.56%, Colgate- Palmolive 1.56%, Dover Corp. 1.56%, Emerson Electric 1.56%, Genuine Parts Co. 1.56%, Johnson & Johnson 1.56%, Procter & Gamble 1.56%, Stanley Black & Decker 1.56% and Hormel Foods 1.56%. Visit ProShares.com for daily fund holdings. Index performance returns are for illustrative purposes only, and do not reflect any management fees, transaction costs or expenses. Indexes are unmanaged, and one cannot invest in an index.
Investing involves risk, including the possible loss of principal. These ProShares ETFs entail certain risks, including imperfect benchmark correlation and market price variance, that may decrease performance. Investments in smaller companies typically exhibit higher volatility. Small- and mid-cap companies may have limited product lines or resources, may be dependent upon a particular market niche and may have greater fluctuations in price than the stocks of larger companies. Small- and mid-cap companies may lack the financial and personnel resources to handle economic or industry-wide setbacks and, as a result, such setbacks could have a greater effect on small- and mid-cap security prices. Technology companies may be subject to intense competition, product obsolescence, general economic conditions and government regulation and may have limited product lines, markets, financial resources or personnel. International investments may involve risks from: geographic concentration, differences in valuation and valuation times, unfavorable fluctuations in currency, differences in generally accepted accounting principles, and from economic or political instability. EUDV may be adversely affected by economic uncertainty experienced by various members of the European Union. In emerging markets, many risks are heightened, and lower trading volumes may occur. Please see summary and full prospectuses for a more complete description of risks. Obtain them from ProShares.com. There is no guarantee any ProShares ETF will achieve its investment objective.
Carefully consider the investment objectives, risks, charges and expenses of ProShares before investing. This and other information can be found in their summary and full prospectuses. Read them carefully before investing. Obtain them from your financial professional or broker-dealer representative or visit ProShares.com.
The “S&P 500® Dividend Aristocrats® Index,” “S&P MidCap 400® Dividend Aristocrats® Index” and “S&P® Technology Dividend Aristocrats® Index” are products of S&P Dow Jones Indices LLC and its affiliates. “Russell 2000® Dividend Growth Index,” “Russell 3000® Dividend Elite Index” and “Russell®” are trademarks of Russell Investment Group. “MSCI,” “MSCI Inc.,” “MSCI Index” and “EAFE” are service marks of MSCI. All have been licensed for use by ProShares. “S&P®” is a registered trademark of Standard & Poor’s Financial Services LLC (“S&P”) and “Dow Jones®” is a registered trademark of Dow Jones Trademark Holdings LLC (“Dow Jones”) and have been licensed for use by S&P Dow Jones Indices LLC and its affiliates. ProShares have not been passed on by these entities and their affiliates as to their legality or suitability. ProShares based on these indexes are not sponsored, endorsed, sold or promoted by these entities and their affiliates, and they make no representation regarding the advisability of investing in ProShares. THESE ENTITIES AND THEIR AFFILIATES MAKE NO WARRANTIES AND BEAR NO LIABILITY WITH RESPECT TO PROSHARES. ProShares are distributed by SEI Investments Distribution Co., which is not affiliated with the fund’s advisor.
