
Katherine Collins, Head of Sustainable Investing at Putnam Investments and Portfolio Manager for Putnam’s two sustainability funds, recently appeared on a webcast with ETF Trends to discuss environmental, social, and governance (ESG) investing. She explained the different ESG strategies that are currently being seen in the industry, and their benefits and limitations.
There are four primary portfolio models being utilized to approach ESG investing by financial advisors: an exclusionary model, an integrated model, inclusionary, and impact portfolios. Collins helped to break down the differences between the four types.
Exclusion
The exclusionary model is one that is typically seen when a fund pulls from a parent index and, by using certain criteria, eliminates some companies from being included within the fund. These strategies have been around the longest in the industry. “For a lot of folks, this still is a natural starting point,” Collins said.
From an ESG perspective, this can be seen in a fund that might choose to exclude fossil fuels, and so pulls from a parent index and eliminates any companies that might own something like fossil fuel reserves. These types of funds typically require lower research requirements over time and have low tracking errors. The impact and alpha potential of the fund is also tied to the performance of the index.
Integration
An integrated portfolio approach incorporates sustainability in the underlying research for the fund. It is one of the most popular and most common ESG models used by asset managers in the industry today. “The integrated approach that starts with a very matter of fact notion that sustainability is relevant and should be considered in a really straightforward way is increasingly the norm,” Collins explained.
Funds of this type cater to investors that believe that ESG is pertinent, and, through the research, attempt to optimize exposure to sustainable companies. It is more research intensive than the exclusionary model and has a higher tracking error margin. Alpha potential is greater in funds of this type than the exclusionary models, as well as impact.
Inclusion
Inclusionary portfolios put sustainability front and center and make ESG the key focus. They are an intentional approach to sustainable investing and how Putnam approaches ESG investing in its two sustainability funds. It is a “proactive, opt-in approach that asks the question, ‘where can I find opportunities where relevant sustainability focus from the companies I’m investing in is adding to the long term investment merit?,'” Collins explained.
Funds of this type focus on ESG leadership within the companies, and companies that are sustainability leaders within their industry. Their primary source of revenue is usually from some type of product or service that falls within the bounds of ESG. These funds tend to require a fair amount of research and the tracking error is higher than with either the exclusionary or integrated models, but the potential for alpha and impact are also higher as well.
Impact
The last type of ESG investment portfolio type is the one that focuses on impact. They are the portfolios with the most narrow focus thematically of the four different types, with a direct drive toward capturing environmental or social impacts, coupled with returns. “In addition to having financial goals a priori, at the very beginning of the process, there are explicit goals for some sort of environmental or social impact,” Collins said.
These funds tend to be more forward looking in their sustainability impacts, require the most amount of research for the securities carried, and have the highest tracking error of all the ESG model options. They also offer the most alpha potential.
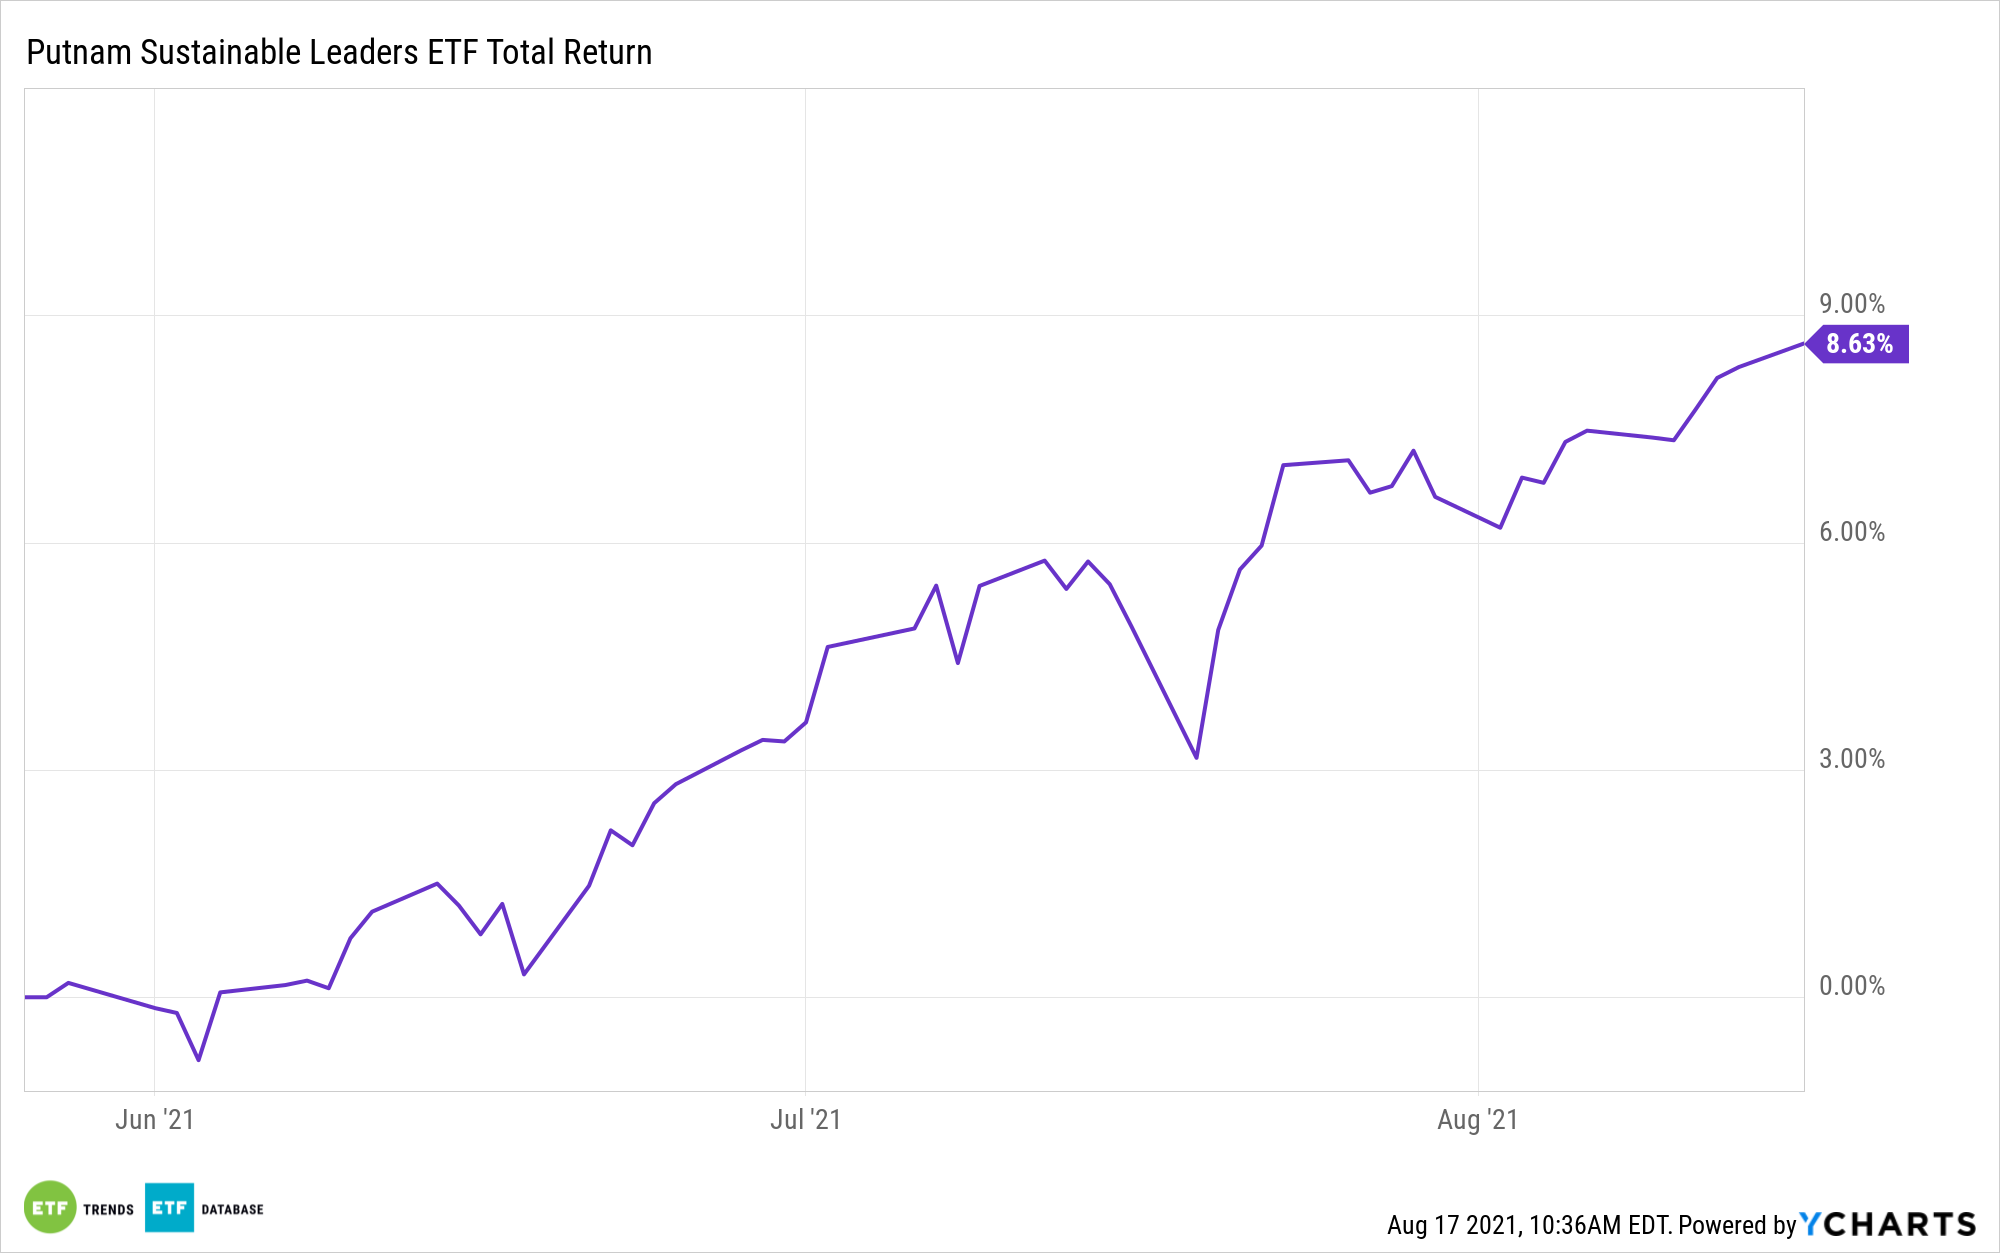
PLDR Invests in the Leaders of Today
The Putnam Sustainable Leaders ETF (PLDR) is an inclusionary ETF that invests in companies whose focus on ESG issues goes well beyond just basic compliance, but for whom ESG is an integral part of their long-term success. These companies have transparent goals and provide consistent, measurable progress updates.
PLDR invests larger percentages of its portfolio in fewer stocks, and the companies invested in by PLDR exhibit creative, proactive leadership in the sustainability issues that create long-term success, both for the company itself and the community as a whole..
As a semi-transparent fund using the Fidelity model, PLDR does not disclose its current holdings on a daily basis. Instead, it publishes a tracking basket of previously disclosed holdings, liquid ETFs that mirror the portfolio’s investment strategy, and cash and cash equivalents. The tracking portfolio is designed to closely track the actual fund portfolio’s overall performance, and actual portfolio reports are released monthly.
Holdings as of the end of June included Microsoft Corp. at 8.45%, Apple at 7.08%, and Amazon.com at 5.26%. The fund was heavily allocated to information technology stocks (31.84%), followed by healthcare at 15.27% and consumer discretionary at 14.96%.
PLDR has an expense ratio of 0.59%.
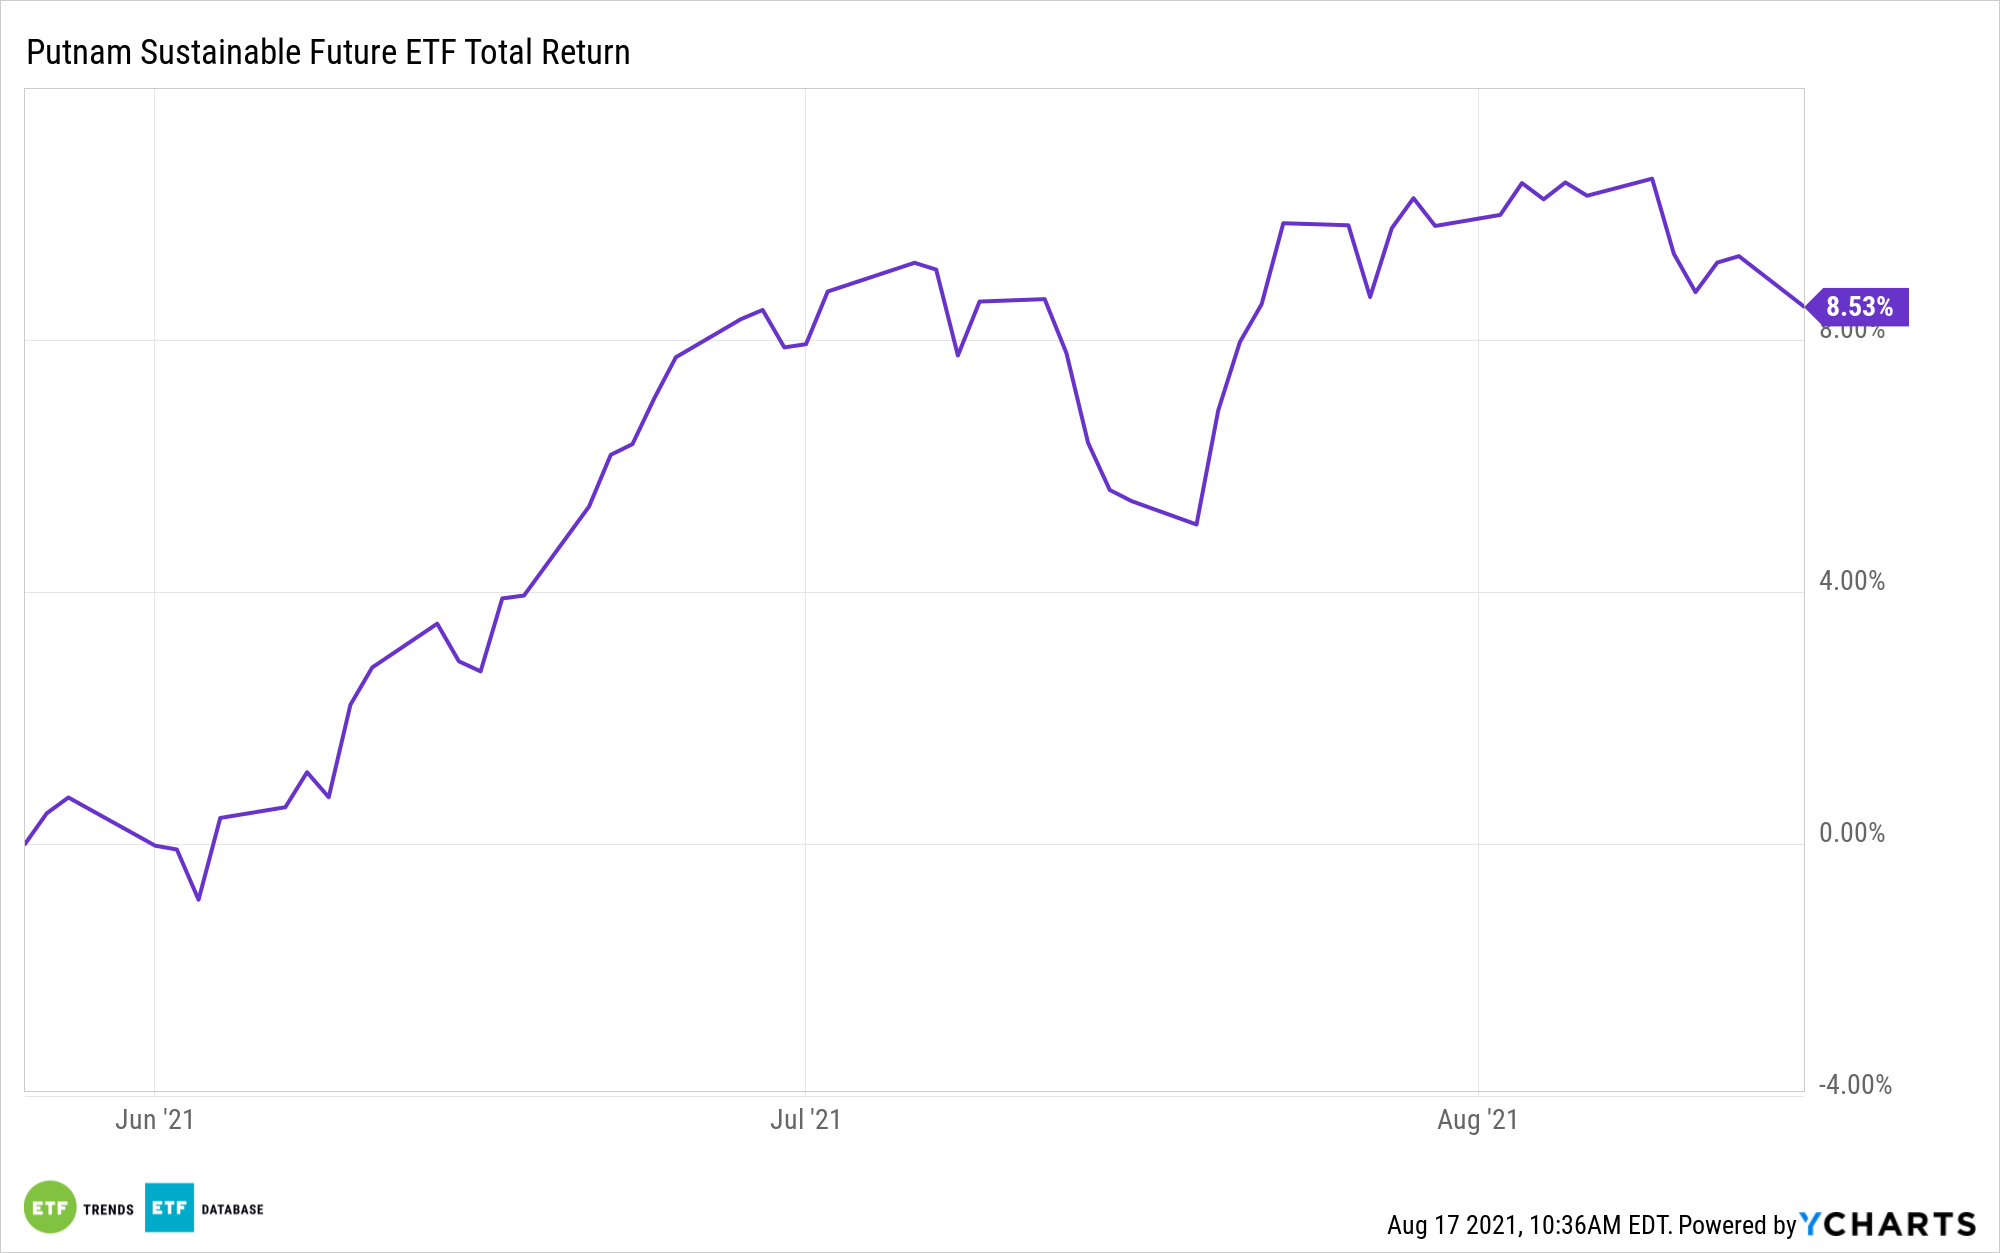
PFUT Invests in the Leaders of Tomorrow
Meanwhile, the Putnam Sustainable Future ETF (PFUT) is an inclusionary ETF that invests in companies seeking to provide solutions to future sustainability challenges. It is a forward-looking approach as these companies are helping to develop ESG and solve problems related to sustainability.
PFUT focuses on impact companies as identified in its sustainability rating system, investing in companies driving economic development, as Putnam believes that strong sustainability practices equate to strong financial growth.
Like PLDR, PFUT is a semi-transparent active ETF. Holdings are disclosed monthly, but as of the end of June, they included Danaher Corp (which designs and manufactures products for professional, medical, industrial, and commercial industries) at 3.53%; Adobe at 3.29%, and Applied Materials at 2.67%.
PFUT’s top sector allocations as of the same time period were 30.55% in healthcare stocks, 30.43% in information technology, and 9.78% to consumer discretionary.
The ETF has an expense ratio of 0.64%.
For more news, information, and strategy, visit the Big Ideas Channel.
