Since the U.S. presidential election in November 2016, markets have experienced a push of optimism that defied the pull of underwhelming macroeconomic and microeconomic data.
The optimism, as measured by various sentiment indicators, began to increase and reached multi-year peaks by February 2017. Risky markets have responded alongside this increasing confidence in a traditional, risk-on fashion.
From 11/8/2016 to 04/30/2017, within U.S. markets, equities, as measured by the S&P 500, returned +12.5%, fixed income, as measured by the Bloomberg Barclays U.S. Aggregate Bond Index, returned -1.9%, and commodities, as measured by the Goldman Sachs Commodity Index, returned +7.9%.
Beginning in March, and lasting through April, the market began to question the elevated sense of optimism, and as of the end of April, the market remains conflicted on whether investor optimism has overestimated future growth.
‘HARD’ VERSUS ‘SOFT’ DATA
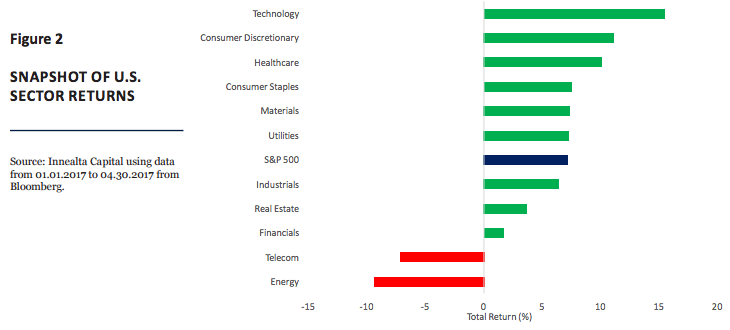
More recently, the divergence between “soft” data, information based on surveys, and “hard” data, information based on measurable outcomes, has reached a significant divergent level. Both data sets are useful to forecast economic growth and asset returns. For example, creating a univariate linear model using Industrial Production, a “hard” data set, since March 1990, implies annual U.S. GDP growth at 2.3%.
However, creating a univariate linear model using Consumer Confidence, a “soft” data set, since March 1990, implies annual U.S. GDP growth at 3.5%. When we analyze other hard and soft data sets, we find a similar pattern. Figure 1 demonstrates the relationship between Consumer Confidence and U.S. GDP growth (YoY%). Moving forward only the actual results of economic growth, such as GDP or corporate earnings, will decide which data set more accurately forecasts economic growth.
Sector Performance
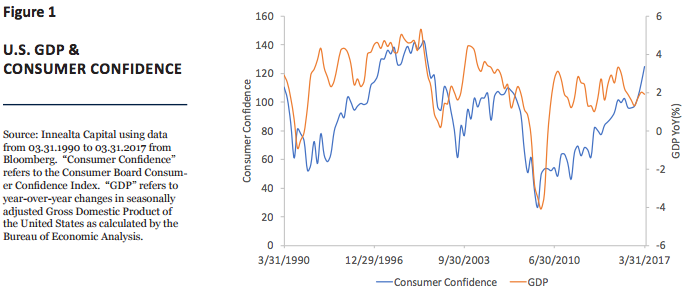
The United States’ economy and financial markets offer the most robust available data sets to perform quantitative analyses. Within U.S. sector returns, we currently see a significant return differential between the top performing sector, Technology, and the bottom performing sector, Energy. Figure 2 shows a snapshot of year-to-date S&P 500 sector returns, as of 04.30.2017.