
![]() By Henry Ma, Julex Capital Management
By Henry Ma, Julex Capital Management
The bull market is in a full swing and everything is becoming more and more expensive. The US equity markets are hitting record highs day after day. The cyclically-adjusted PE ratio (Shiller PE) has reached 31.2, which is 90% higher than its historical average of 16.8 since 1880 (see Figure 1). High yield bonds, the fixed income instruments with the lowest credit qualities, joined the rallies as well. The credit spread of the high yield bonds has declined to 370 basis points, which is well below its historical average of 573 basis points since 1997. Housing prices nationwide have recovered and exceed the pre-crisis levels (see Figure 2).
Figure 1. Shiller PE

Source: Multpl.com
Figure 2: Home Price and High Yield Bond Spread
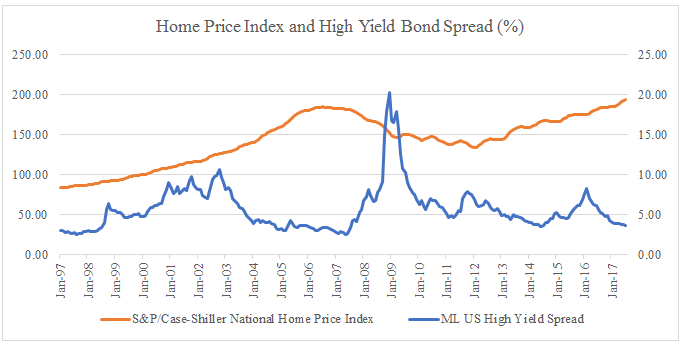
Source: FactSet.
Astonishingly, synthetic CDOs, which rose to notoriety during the subprime crisis and then faded into obscurity after nearly destroying the financial system, staged a comeback. Banks have issued roughly $70 billion of synthetic CDOs in recent years. More ironically, Citi Group, which was bailed out by the government during the financial crisis, emerged as a dominant player in the market. The high valuation across the all asset classes and re-emergence of complex financial instruments make investors wonder: are we entering another credit-fueled bubble?
The root cause of the financial crisis was easy credit. Because mortgage loans could be easily repackaged into CDOs, lenders were incentivized to loosen lending standards and underwrite risky loans like subprime mortgages. Meanwhile, homeowners were also incentivized to borrow beyond their means. When the housing market finally collapsed in 2007, mortgage and CDO defaults skyrocketed, resulting in a nationwide financial crisis. After the crisis, despite the extraordinarily low interest rates, the private sectors and households were focusing on deleveraging their balance sheets, and banks were tightening their leading standards under new regulations. Consequently, we have not seen any excessive lending and borrowing for now. Figure 3 shows the private sector and household debts as a percentage of GDP have been declining after they peaked in 2008. The current debt levels are significantly lower. It will be hard to argue that the current high asset valuation is a result of excess credit creation.
Figure 3: Household Debt to GDP and Private Debt to GDP Ratios
