
Everyone is going to be keying in on a certain trend line on Monday morning and how the market reacts around it. It doesn’t matter what type of investor you are – fundamental, technical, strategic, passive, active, whatever…. When push comes to shove, everyone wants to know if the 200-day simple moving average will hold or fold.
I wrote a lengthy post last year on the 200-day moving average that I think is very important to frame the context and history of this trend line. In it, I outline several key points for to investors consider with respect to a defense or breach of this area and what it may mean for changes to their portfolio.
![]()
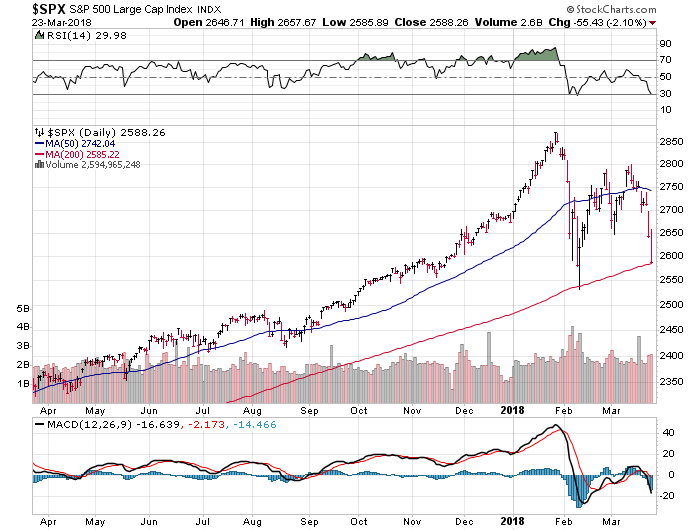
Below are my observations of the current market and what I see on the chart as of March 25, 2018:
The S&P 500 Index is starting the week down -3.2% on the year and -10% off the high. It’s right in the middle of “correction” territory in market lingo.
The 200-day moving average on the S&P 500 Index is still in an uptrend (or upslope) and is climbing at an appreciable pace. It’s roughly 50 S&P points higher than the intra-day level that was tested back in February.
Long-term averages (by definition) are slow to change. Think of it like getting a freight train or aircraft carrier moving in one direction. It takes a lot of time and energy to ultimately disrupt the current trend.
A re-test of the February intra-day low would still be considered a technical break of the 200-day moving average. I think this area is probably more important from a risk management standpoint than the trend line itself.
A successful re-test and hold of the February lows would likely be viewed as an overall bullish sign and create a more stable base of support to trade against.