By Christopher Gannatti, Associate Director of Research
After the global financial crisis of 2008–2009, all investors started paying close attention to central bank activity. Then the U.S. Federal Reserve’s (Fed) chairman, Ben Bernanke, provided innovative solutions that contributed to pulling the U.S. economic system back from the brink of collapse, and since then, many other global central banks have borrowed from and even expanded upon that initial playbook.
The result: We are all paying a lot more attention to how the U.S. dollar is moving against other global currencies.
The Euro Appreciated More Than 14% in 2017
The strength and intensity of this move caught us (and many others) by surprise in 2017, as the European Central Bank (ECB) was continuing both its negative policy rate and quantitative easing programs in earnest. One of the biggest effects of this move was that we saw many U.S. investors in exchange-traded funds (ETFs) shifting from hedged to unhedged European equity exposures.
We found this interesting, in that many investors tell us that they find it difficult to time currency movements. However, we have to figure that a double-digit move can tilt the seesaw so that the “fear of missing out” on any further currency appreciation trumps remembering how tricky currency forecasting can be.
![]()
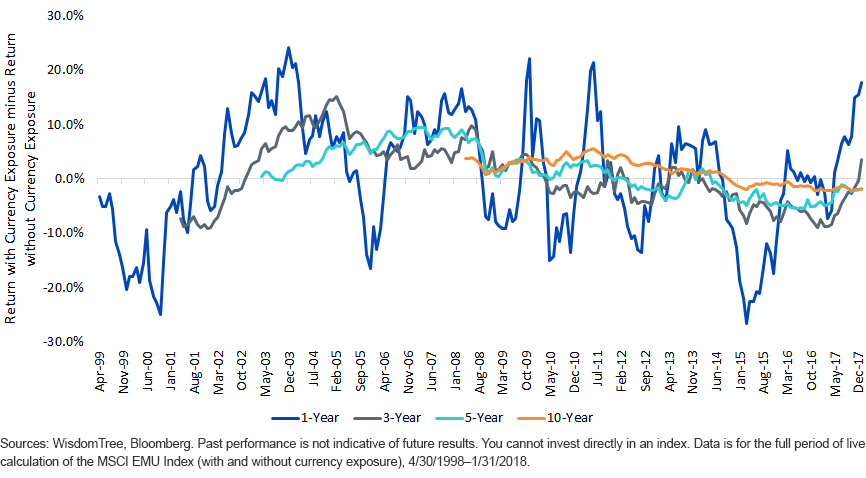
How Different Have Local and U.S. Dollar Returns Been? The MSCI EMU Index Example
MSCI EMU Index USD vs Euro

One-Year Rolling Differences: Clearly, these differences are noticeable and they tend to influence investor behavior. At the beginning of 2017, for example, this difference was basically flat, but at present, it is approaching 20% (in favor of having currency exposure), and we all know where the flows have been heading.
On average, the difference between having and not having exposure to the euro’s moves against the U.S. dollar has been less than 1% on a rolling one-year basis, but the standard deviation of this difference is 11%, telling us that—while it has averaged out over time—at any given time the chance of seeing a value near 1% has been relatively low.
It’s also clear that since the beginning of the European Monetary Union in the late 1990s, the high end of the range for the outperformance of having currency exposure has been around 20%. In the past, mean reversion has had a powerful gravitational pull—we didn’t see this outperformance gap get to 30% on a rolling one-year basis, meaning that having no currency exposure has tended to quickly come back into favor.
10-Year Rolling Differences: Many people believe that the difference between having and not having currency exposure “comes out in the wash” over longer periods. The data supports this, in that the average difference is quite small on a rolling 10-year basis, and the standard deviation of this difference is around 2%.
Building a Strategic Allocation to European Equities
Still, we recognize that many investors may not have the fortitude to stay the course on their portfolio allocations for 10-year periods, so it makes sense to focus on ways to make things more easily stomached on a year-by-year basis.
