
The landscape of active ETFs is hot and appears to be getting hotter. Recent media coverage of active funds found accelerating flows into actively managed funds. Given the growing popularity of active, investors and advisors may want to consider which strategies are sending buy signals when examining their options.
The T. Rowe Price Blue Chip Growth ETF (TCHP)
The T. Rowe Price Blue Chip Growth ETF shows strong momentum based on its simple moving averages (SMAs). In technical analysis, SMAs can help indicate whether a security has momentum, per YCharts. The fund’s price sits above both its 50- and 200-day SMAs. Its price has sat above both metrics since the fall.
TCHP charges 57 basis points (bps) for its active approach. It has performed very well among active ETFs, returning 49.7% over one year. The strategy looks for firms poised for above-average growth. Its active managers consider factors like dividend growth, strong financial fundamentals, and more.
See more: Rate Cuts Not Coming? Active ETFs Can Help
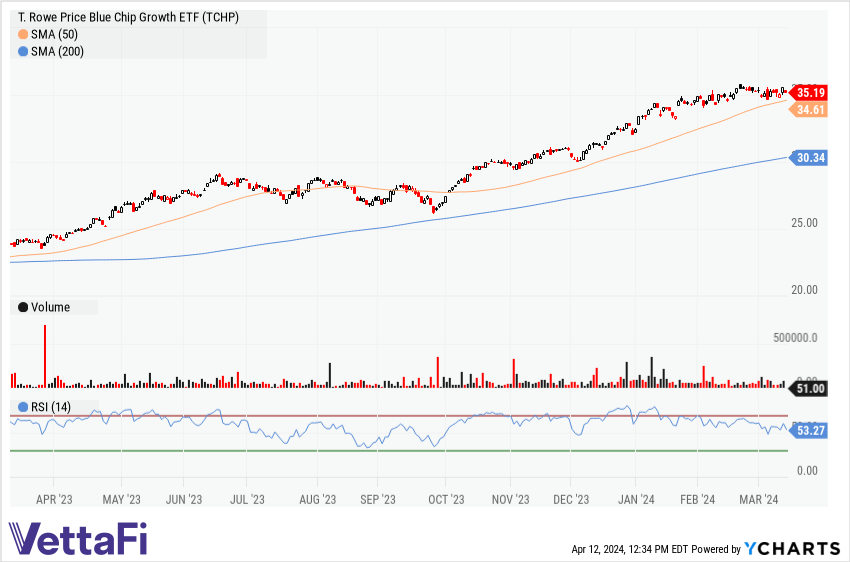
TCHP’s tech chart.
The T. Rowe Price Growth Stock ETF (TGRW)
The T. Rowe Price Growth Stock ETF’s price also sits above both of its SMAs. As seen in its chart from YCharts below, TGRW has sat above both metrics since the fall, just as TCHP has. That indicates momentum that may intrigue investors. The strategy charges 52 bps for its approach.
The ETF looks for firms with strong cash flow, above-average rate of earnings growth, and a strong market position. In doing so, it has returned 45.3% over one year. That has helped it outperform its ETF Database Category and FactSet Segment averages.
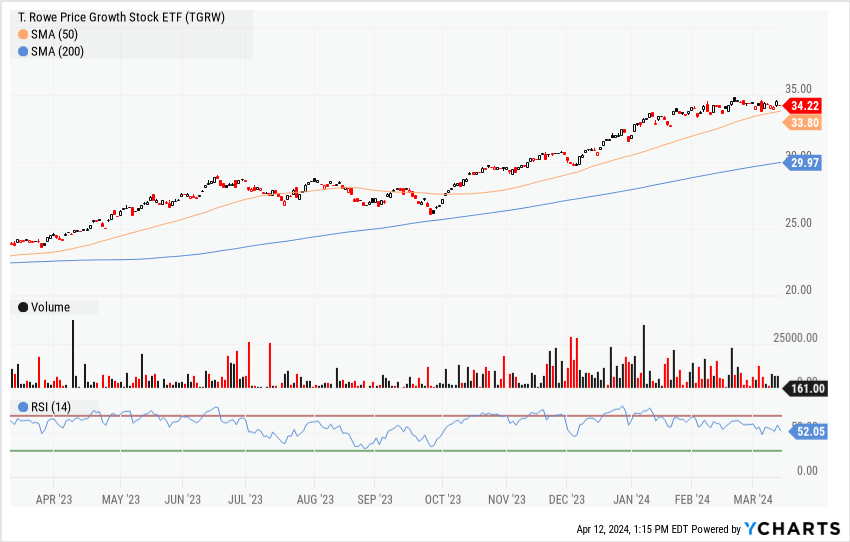
TGRW’s tech chart.
The T. Rowe Price Capital Appreciation Equity ETF (TCAF)
Finally, the T. Rowe Price Capital Appreciation Equity ETF’s price also sits above its SMA; however, given it just launched last year, it has yet to gather longer data than a 50-day SMA, per YCharts. Still, despite its recent launch, it has gathered significant AUM. The ETF hit $1 billion in just nine months.
TCAF has done well among active ETFs. It has returned 8.7% YTD, outperforming both its averages. The fund invests looking for firms with a track record of attractive valuations as well as strong market positions. It charges 31 bps.
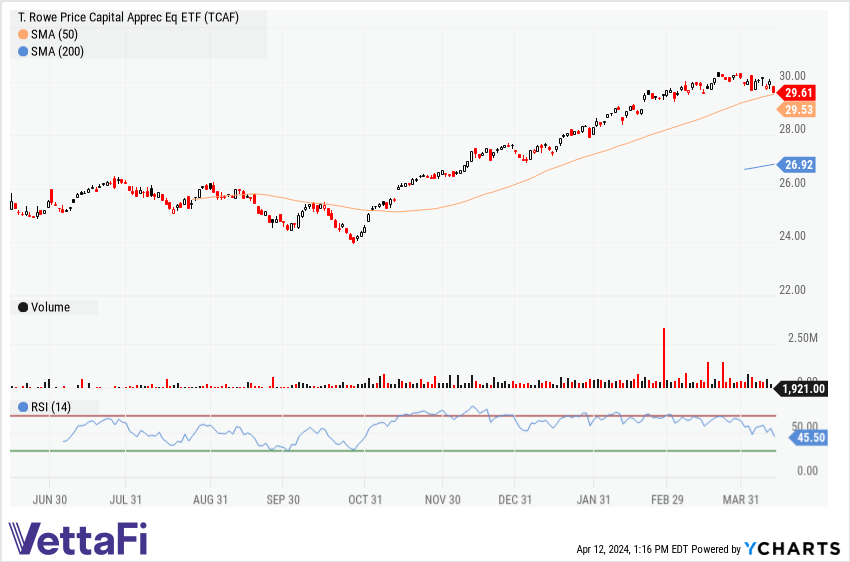
TCAF’s tech chart.
Taken together, the trio of strategies presents intriguing options based on technical analysis. Each offers a different route into active ETFs, sending buy signals, per YCharts.
For more news, information, and strategy, visit the Active ETF Channel.
