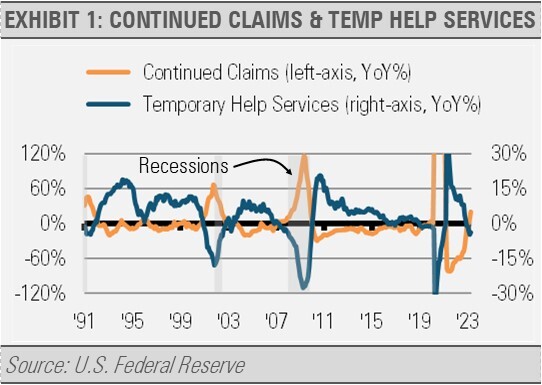
Our work suggests that we should be prepared for more economic and market turmoil in the near-term. Some of our longer lead-time indicators that typically lead the business cycle by about a year, such as the slope of the yield curve and broad money growth, began to flash cautionary signals last year. More recently, some of our near-term leading indicators have begun signaling caution as well. For example, continued claims for unemployment benefits are increasing at a pace that is typically only seen near the end of a business cycle. Additionally, temporary employment has declined at a pace suggesting a softening labor market ahead.

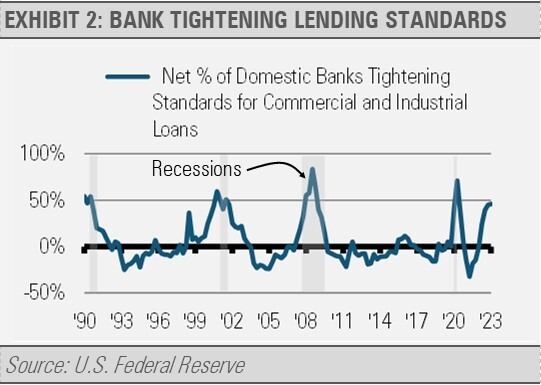
In addition, the prices of industrial metals have declined which suggests slackening global demand while U.S. bank lending standards have tightened significantly since well before the latest banking turmoil. Tightening lending standards leads to slower economic activity ahead as businesses find it more difficult to fund investments.

Meanwhile, our longer-term outlook for the U.S. economy and markets has become even brighter. Not all recessions and recoveries are created equal, and the length and depth are highly dependent on the economic and market conditions leading up to them. Our work suggests that the next U.S. business cycle will be built on a foundation of strong household and business balance sheets after a decade of low interest rates, positive demographic trends, and trends in global trade that will benefit the U.S.-centered trading bloc. In addition, historically low unemployment can go a long way to setting the stage for the next business cycle as increases in unemployment will likely still leave the rate at low levels relative to historical norms.
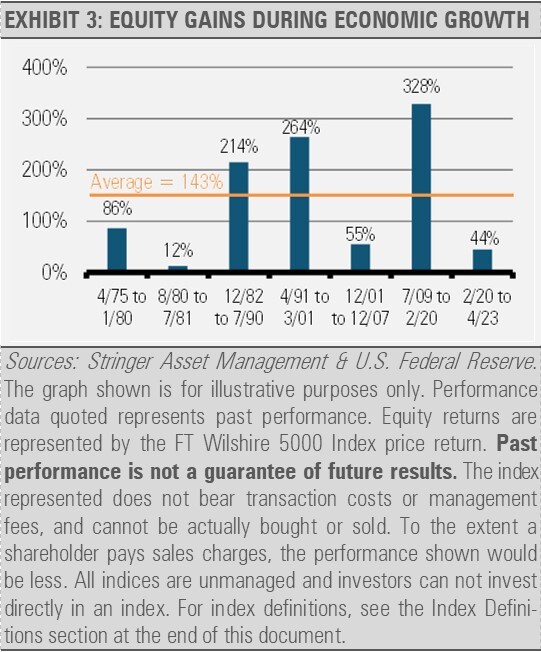
As the following chart illustrates, the positive economic fundamentals of each new business cycle have historically produced attractive equity results. For example, over the seven business cycles since April 1975, the average price gain of the Wilshire 5000 Index of U.S. equities, not including dividends, was 143%. In addition, the recent increase in interest rates will likely result in attractive returns for domestic bond portfolios as well. Overall, we are more optimistic about what the next business cycle holds for U.S. investors than we have been in years.

INVESTMENT IMPLICATIONS
History teaches us that attempting to get the timing of these economic and market shifts just right can be damaging to long-term investment results. Instead of trying to time the markets, we have prepared our Strategies to be more resilient to potential shocks.
Given our cautious outlook on the global economy and financial markets, our Strategies are emphasizing current yield and downside protection in addition to potential capital appreciation. We are utilizing a variety of investment approaches including defensive equity positions, options strategies, master limited partnerships, and Treasury bonds for potentially both yield and capital appreciation. These investments not only offer the potential for income but can also function as a ballast against economic declines.
News cycles, negative headlines and volatility can have a detrimental effect on any investor’s ability to stay the course. Having the ability to manage risk in real time and reduce volatility can make all the difference.
THE CASH INDICATOR
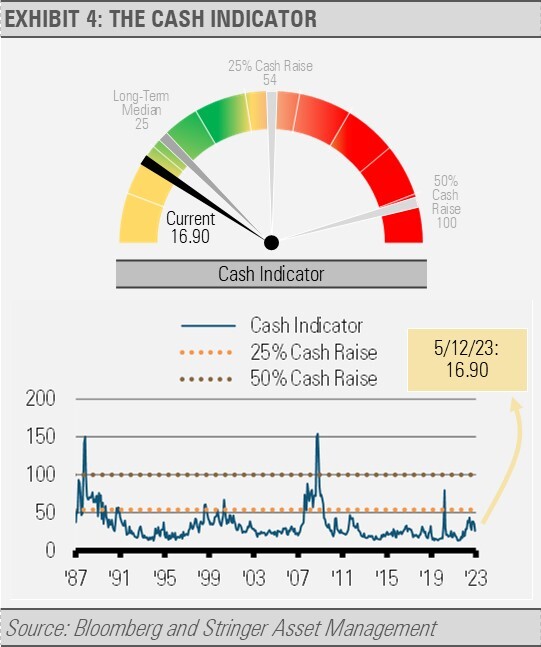
The Cash Indicator (CI) has fallen below its long-term median. At this level, the CI suggests that the markets may be somewhat overly complacent and are not pricing in as much risk as we normally see. Still, at its current level, the CI suggests that markets are far from a massive dislocation. Instead, we think that investors should expect an increase in risk and volatility over the coming months.

For more news, information, and analysis, visit the ETF Strategist Channel.
DISCLOSURES
Any forecasts, figures, opinions or investment techniques and strategies explained are Stringer Asset Management, LLC’s as of the date of publication. They are considered to be accurate at the time of writing, but no warranty of accuracy is given and no liability in respect to error or omission is accepted. They are subject to change without reference or notification. The views contained herein are not to be taken as advice or a recommendation to buy or sell any investment and the material should not be relied upon as containing sufficient information to support an investment decision. It should be noted that the value of investments and the income from them may fluctuate in accordance with market conditions and taxation agreements and investors may not get back the full amount invested.
Past performance and yield may not be a reliable guide to future performance. Current performance may be higher or lower than the performance quoted.
The securities identified and described may not represent all of the securities purchased, sold or recommended for client accounts. The reader should not assume that an investment in the securities identified was or will be profitable.
Data is provided by various sources and prepared by Stringer Asset Management, LLC and has not been verified or audited by an independent accountant.
Index Definitions:
FT Wilshire 5000 Index Price Return – This Index is a broad-based market capitalization-weighted index that seeks to capture 100% of the United States investible market. The Index includes all U.S. equities with readily available prices, with thinly-traded and bulletin-board issues excluded. As with all market capitalization-weighted indices, this Index overweights companies with a higher firm value and underweights those with a lower firm value. The price return excludes dividends and reinvestments of income.

