
The S&P 500 just experienced its worst week of the year so far. In fact, it was the worst week that the market has seen since September. The decline was led by banking stocks, but volatility was broadly felt across most major market sectors.
Up until last week, the S&P 500 had experienced five “outlier” days on year. An outlier day is any trading day that is either up or down 1.50%. Last week’s fluctuations brought the total number of outlier days for 2023 up to seven, after adding two downside outliers in a span of four trading days. Although it technically did not qualify as an outlier, Friday was on the cusp of also being down nearly -1.50%.
Needless to say, volatility rose a few points last week. Let’s step back and evaluate the current state of the markets, and what the plan is, in this particular case, for dealing with volatility.
Brief update on the Market
Technology
Last weeks decline was mostly driven by financial stocks. The Financials sector, which had previously been one of the higher ranked US sectors, on a risk adjusted basis, experienced “whoosh” in volatility. According to the Canterbury Volatility Index, Financials went from CVI 80 to CVI 103 in a matter of four days. That is quite the spike.
Equally surprising, the S&P 500’s largest market sector, Information Technology, did not experience the same rise in volatility. Last year, technology stocks had the highest level of volatility. Heading into this year, volatility for the tech sector index had declined from CVI 195 (in November 2022) to CVI 126, which is a significant, positive development. Even with last week’s broad market decline, the CVI of the technology sector did not increase. Given large weighting in several indexes, that is a good sign for the broad markets, specifically the Nasdaq and S&P 500
Take a look at the chart below, which shows the Technology sector ETF (XLK). Currently, the sector is (1) sitting on horizontal support, (2) above its 200-day moving average, and (3) has declining volatility, which was stagnant last week.
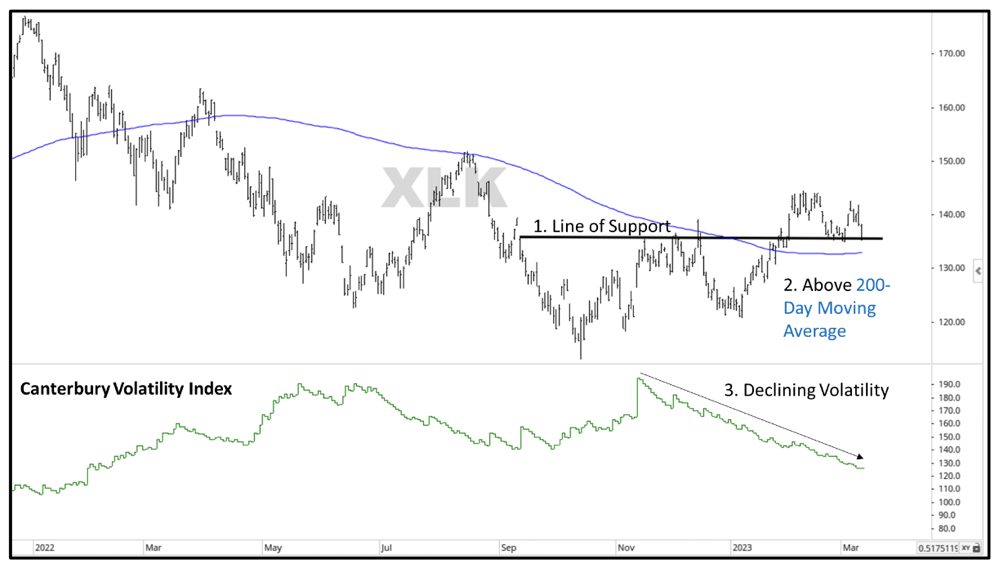
Source: Canterbury Investment Management. Chart created using Optuma Technical Analysis Charting Software.
International Stocks
International stocks continue to lead the equity markets on a risk adjusted basis. This has been a theme all year and particularly true for most European stocks. Part of international equity strength comes from US Dollar weakness. An international stock or ETF’s return comes as a function of (1) performance and (2) currency exchange. In other words, a weak dollar contributes positively to an international stock or ETF.
The chart below shows the US Dollar. The lower half of the chart shows the Dollar’s RSI (relative strength index which measures overbought and oversold conditions).
When the RSI line rises above the upper blue line, the Dollar is overbought. When it dips below the lower green line, it is oversold. You can see that prior to 2023, the Dollar had been near oversold conditions for awhile. Then, in late February, become oversold. Now, the Dollar is experiencing a sell-off in the short-term. A weak dollar bodes well for international equities.
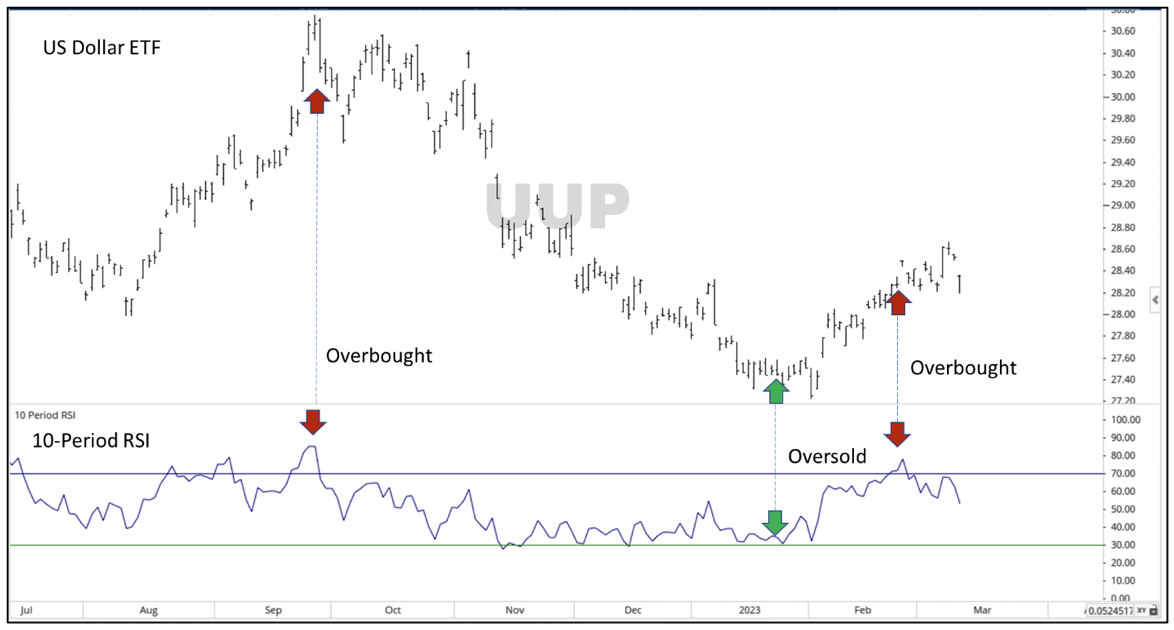
Source: Canterbury Investment Management. Chart created using Optuma Technical Analysis Charting Software.
Managing Volatility and the Bottom Line
The market saw volatility last week, and more importantly, saw some rotation. When it comes to experiencing market fluctuations, the first step is to not become emotional and attempt to make short-term, sometimes irrational decisions, when dealing with an irrational market. In other words, you do not want to panic sell when the markets become emotional, nor do you want to panic buy something that could be seen as a falling knife. In other words, stocks tend to trend. A stock that has been dropping is likely to continue to drop.
It is important to pay attention to market rotations. As securities ebb and flow together, some will begin to show more favorable characteristics. We gave a brief example of this with Technology stocks. While markets declined, technology stocks showed positive relative strength. International equities continue to show strength.
If volatility continues to climb, and prices drop, more “defensive” sectors or asset classes (like inverse securities) will rise up rankings lists. A security like Inverse Real Estate has been highly ranked recently and has performed well during a declining market.
The most important aspect of dealing with volatility is maintaining a consistent portfolio management philosophy. It is important to adapt your portfolio’s holdings to deal with new and existing market conditions. As volatility rises or falls, the portfolio should make adjustments to make diversification more effective. The goal is to maintain consistent portfolio volatility, limit the number of portfolio “outlier days” in order to move in concert with everchanging market environments- bull or bear.
For more news, information, and analysis, visit the ETF Strategist Channel.
