
By Rod Smyth, Chairman of the Board of Directors
SUMMARY
- In our view, higher interest rates will help investors in the sustain phase by providing more stable income.
- However, portfolios will likely still need greater exposure to ‘risk assets’, such as stocks and higher yielding bonds, to meet return objectives, in our opinion.
- Understanding and managing those risks is key to finding the right balance between preservation and growth.
Pre-Retirement: Balancing ‘Growth’ and ‘Preservation’
The ten years leading up to retirement, what we call the sustain phase, can be scary. Investors are likely to have questions such as:
- Will I have saved enough to fund my retirement?
- How can I mitigate the risk that my savings will see a significant decline just before I retire?
- If I feel I have not saved enough, should I take more risk to seek higher returns?
In our view, the sustain phase is about balancing two objectives: continuing to grow the portfolio’s value while also preserving the savings thus far. This in turn likely necessitates a better understanding of your own risk tolerance – really understanding the trade-offs between these two objectives. Following the accumulation phase (see The 21st Century Retirement: Accumulate Phase), the size of your portfolio likely means that market returns will have a bigger impact than contributions, and so the consequences of your decisions increase as retirement approaches. We have observed over many years how a well-thought-out plan, combined with regular reviews and ongoing market insight, can significantly increase investors’ confidence and peace of mind.
When the sustain journey ends, a potentially long distribute phase begins (see The 21st Century Retirement: Distribute Phase). The process of deciding on a spending plan for retirement and ensuring there are sufficient funds to make the plan work is the goal of the sustain phase. Investing is not a science and long-term assumptions about returns should, out of necessity, include a variety of scenarios, in our view. Equally, as life circumstances change, so should the plan. Thus, we advise flexibility and regular reviews.
Managing a Portfolio in the Lead up to Retirement is Challenging for the Following Reasons:
- Life expectancy is increasing: In the US, life expectancy has increased steadily from 68 years old, in 1950 to 79 years old today according to the United Nations, and they forecast it will rise to 84 by 2055. Therefore, the asset pool at retirement must be larger than has historically been the case. We cover this in greater detail in our recent Strategic View, Beware the Lure of Cash.
- Few guaranteed pensions: In the past, many large employers provided a guaranteed pension, meaning retirement income was your employers’ problem. Now these ‘defined benefit’ plans are rare and with the move to defined contribution plans (such as 401k plans), the burden of retirement income has been shifted to employees who must build up savings and invest it themselves. Investors with insufficient savings are tempted to have excessive exposure to risky assets, trying to achieve unrealistic spending goals. Being flexible with your retirement age (if possible) is a better solution than taking excessive risks, in our view.
- The stakes are higher: If successful in the accumulation phase, your ‘Nest Egg’ has grown larger and so the dollar swings are amplified, literally and emotionally. We think this requires a new mindset. Contributions are now much smaller in relation to the portfolio’s size and so new contributions are usually too small to offset large drawdowns of the total portfolio.
- Managing the time horizon: In the accumulation phase, time is your friend since a longer time horizon offers the chance for the portfolio to recover from a setback; and contributions can take advantage of bear markets to buy at lower prices. However, the sustain phase is a diminishing time horizon in the journey to the distribute phase. In one sense the sustain investor still has the longer time horizon of their retirement years, but they must also manage the risk of a significant drawdown just before contributions stop and distributions begin.
The Challenges of Generating Inflation Adjusted or ‘Real’ Returns
With higher yields, bonds are more attractive as long as inflation continues to fall. When we last updated this piece in January of 2021, short term interest rates were close to zero and the yield on the 10-year Treasury bond was roughly 1.1%. Since then, the Federal reserve has raised interest rates to 4.5% and currently 10-year Treasury yields are just under 4%, as shown in the chart to the right. From an absolute perspective, this is great news for investors as they can finally generate a decent return on their money percentage. However – and this is critical – these interest rates are not keeping up with current inflation rates. In our view, this situation is likely to continue through the first half of 2023.
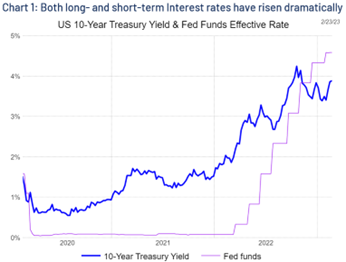
Source: Refinitiv Datastream, RiverFront. Data weekly as of February 23, 2023. Shown for illustrative purposes only. Past Performance is no guarantee of future results. Chart right.
The outlook for Inflation: Peaking, but likely to remain above the Fed’s 2% target throughout 2023. The Federal Reserve is now fully committed to bringing inflation down as their number one priority, something that has been repeated by Fed Chairman Powell at every opportunity for many months. We believe the Fed will ultimately succeed, and indeed leading indicators of inflation are already declining. However, it may take a recession to bring inflation down to the Fed’s target, in our opinion.
In the longer term, investors seem to be confident that long-term inflation rates will fall. However, investors concerned about inflation can now get a positive yield on the Treasury’s Inflation Protected Bonds (TIPS) of around 1.5% over inflation, as seen in the chart to the right. Investors should note that the price of these securities, like other bonds, fall when interest rates rise, and so fail to provide protection against rising rates.
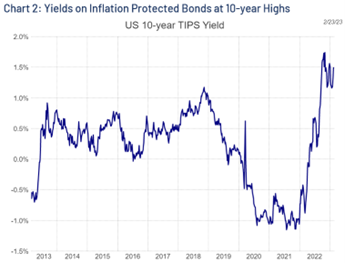
Source: Refinitiv Datastream, RiverFront. Data weekly as of February 23,2023. Shown for illustrative purposes only. Past Performance is no guarantee of future results.
The Role of Stocks: Capital Appreciation and a Growing Dividend Stream
We believe investors seeking to generate a 3-6% return over inflation will need to invest a significant portion of their assets in more volatile investments to get the higher returns they seek. Let’s call these “risk assets”, which can include stocks, investment grade bonds, higher yield “junk” bonds, real estate, and other investments.
US stocks, with dividends reinvested, have a return history relative to inflation going back to 1926, shown in the chart below. The trend rate of return is 6.4% over the rate of inflation (see yellow trend line rising at 6.4% per annum). This is considerably higher than the return on TIPS. Stock’s ability to outpace inflation comes, in part, due to companies’ ability to adapt to changing conditions.
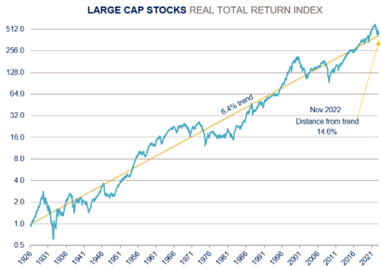
Source: RiverFront Investment Group, calculated based on data from CRSP 1925 US Indices Database ©2022 Center for Research in Security Prices (CRSP®), Booth School of Business, The University of Chicago. Data from Jan 1926 through October 2022. Past performance is no guarantee of future results. It is not possible to invest directly in an index. RiverFront’s Price Matters® discipline compares inflation-adjusted current prices relative to their long-term trend to help identify extremes in valuation. Blue line represents the Large Cap Real Return Index. Yellow line represents the Annualized Real Trend Line of Large Cap Real Total Return Index according to Price Matters®. Shown for illustrative purposes only, not indicative of RiverFront portfolio performance. Information or data shown or used in this material was received from sources believed to be reliable, but accuracy is not guaranteed. The chart above uses a logarithmic scale. Line movements will be dampened/subdued based on the exponential y-axis.
More stocks mean more volatility: Although US stocks have delivered trend returns of 6.4% over inflation since 1926; returns in 3, 5 and even 10-year timeframes can be significantly different from the trend (blue line above), both better and worse. Thus, for a sustain investor there is an element, sometimes significant, of good or bad fortune. Since the last 10 years before retirement has such a big influence on the portfolio’s value, someone retiring in say 2000 would have had a very different experience, both before and after, from the person retiring in 2009. One way to manage this element of randomness is to rebalance portfolios, following an exceptionally good or bad year. Another good practice is to move towards the mix you believe is appropriate for your retirement years, in the last few years of the sustain phase. We believe an investor in the sustain phase who understands their personal tolerance for drawdowns in value due to market volatility is better able to set and achieve realistic goals.
The Building Blocks of a 21st Century Retirement Plan: Sustain Phase
More Risk Assets: Although bond yields are higher now, they are not likely to deliver returns much above inflation. Thus, when constructing a plan for the sustain phase, we suggest using enough ‘risk assets’ such as stocks and higher yielding bonds to offer the opportunity of providing the required returns. Riskier assets require more careful selection and closer scrutiny. For example, when incorporating stocks (domestic and overseas) and high-yield bonds, we think it is important to understand the specific risks of each investment, which may not be obvious upon cursory review. We believe this is a decision that should be actively managed and monitored.
Diversification: Regarding stocks, we suggest a mix of those that pay dividends and those that don’t. In the sustain phase we tend to prefer companies that we believe have the greatest potential to grow dividends, rather than those with the highest starting yield, as we believe growth of income is more important prior to the distribute phase. We also want to invest for growth from capital appreciation. Companies in faster-growing sectors often reinvest their excess cash flow in their own businesses to fund expansion. In the high growth phase of their evolution, it may not make sense to pay dividends. We want to include these stocks as we think they can play an important role in growing the value of the portfolio. Additionally, with higher interest rates there are now opportunities in higher yielding corporate bonds, but these kinds of bonds can see significant defaults in a recession. Selecting the right mix of bond types and maturities is an active decision in our view, and one that RiverFront considers carefully in our portfolios.
Risk Mitigation: Given the higher stakes in the sustain phase – namely a larger portfolio and less time until retirement -dealing with the price swings of risky assets involves risks that go beyond price volatility. In our experience, investors plan in 5 and 10-year time horizons during calm times, but often abandon the plan when volatility spikes. In our view, investors sometimes succumb to fear and greed by reacting to current headlines and making significant changes to portfolio positioning, often contrary to their stated long-term plan. Selling after a significant market correction is one of the most damaging things an investor can do, in our opinion. We call this Emotional Risk. We believe a critical part of the retirement planning process is to assess and periodically review risk tolerance to build a plan that allows the retiree to weather market volatility. Thus, in the sustain phase, we believe the optimal portfolio is not necessarily the portfolio that might produce the maximum returns, but the one that allows investors to complete the journey. This involves a realistic understanding of the potential longer-term tradeoff between returns and safety.
How RiverFront Can Help
The sustain journey is a bridge between the accumulate phase of investing for capital appreciation and the distribute phase of managing cashflow in retirement. At RiverFront, we believe investors will need to maintain a larger allocation to stocks in the sustain phase due to low interest rates and our portfolio solutions reflect this belief. This will likely involve bigger swings in quarterly portfolio values. We think our focus on portfolio construction, risk management, transparency, and consistent communication are critical elements in giving financial advisors and their clients the peace of mind to stick with the agreed plan.
Risk Discussion: All investments in securities, including the strategies discussed above, include a risk of loss of principal (invested amount) and any profits that have not been realized. Markets fluctuate substantially over time, and have experienced increased volatility in recent years due to global and domestic economic events. Performance of any investment is not guaranteed. In a rising interest rate environment, the value of fixed-income securities generally declines. Diversification does not guarantee a profit or protect against a loss. Investments in international and emerging markets securities include exposure to risks such as currency fluctuations, foreign taxes and regulations, and the potential for illiquid markets and political instability. Please see the end of this publication for more disclosures.
Important Disclosure Information:
The comments above refer generally to financial markets and not RiverFront portfolios or any related performance. Opinions expressed are current as of the date shown and are subject to change. Past performance is not indicative of future results and diversification does not ensure a profit or protect against loss. All investments carry some level of risk, including loss of principal. An investment cannot be made directly in an index.
Information or data shown or used in this material was received from sources believed to be reliable, but accuracy is not guaranteed.
This report does not provide recipients with information or advice that is sufficient on which to base an investment decision. This report does not take into account the specific investment objectives, financial situation or need of any particular client and may not be suitable for all types of investors. Recipients should consider the contents of this report as a single factor in making an investment decision. Additional fundamental and other analyses would be required to make an investment decision about any individual security identified in this report.
All charts shown for illustrative purposes only. Technical analysis is based on the study of historical price movements and past trend patterns. There are no assurances that movements or trends can or will be duplicated in the future.
Stocks represent partial ownership of a corporation. If the corporation does well, its value increases, and investors share in the appreciation. However, if it goes bankrupt, or performs poorly, investors can lose their entire initial investment (i.e., the stock price can go to zero). Bonds represent a loan made by an investor to a corporation or government. As such, the investor gets a guaranteed interest rate for a specific period of time and expects to get their original investment back at the end of that time period, along with the interest earned. Investment risk is repayment of the principal (amount invested). In the event of a bankruptcy or other corporate disruption, bonds are senior to stocks. Investors should be aware of these differences prior to investing.
In general, the bond market is volatile, and fixed income securities carry interest rate risk. (As interest rates rise, bond prices usually fall, and vice versa). This effect is usually more pronounced for longer-term securities). Fixed income securities also carry inflation risk, liquidity risk, call risk and credit and default risks for both issuers and counterparties. Lower-quality fixed income securities involve greater risk of default or price changes due to potential changes in the credit quality of the issuer. Foreign investments involve greater risks than U.S. investments, and can decline significantly in response to adverse issuer, political, regulatory, market, and economic risks. Any fixed-income security sold or redeemed prior to maturity may be subject to loss.
Index Definitions:
Standard & Poor’s (S&P) 500 Index measures the performance of 500 large cap stocks, which together represent about 80% of the total US equities market.
U.S Market Cap index information calculated based on data from CRSP 1925 US Indices Database ©2023 Center for Research in Security Prices (CRSP®), Booth School of Business, The University of Chicago. Used as a source for cap-based portfolio research appearing in publications, and by practitioners for benchmarking, the CRSP Cap-Based Portfolio Indices Product data tracks micro, small, mid- and large-cap stocks on monthly and quarterly frequencies. This product is used to track and analyze performance differentials between size relative portfolios. CRSP ranks all NYSE companies by market capitalization and divides them into ten equally populated portfolios. Alternext and NASDAQ stocks are then placed into the deciles determined by the NYSE breakpoints, based on market capitalization. The series of 10 indices are identified as CRSP 1 through CRSP 10, where CRSP 10 has the largest population and smallest market-capitalization. CRSP portfolios 1-2 represent large cap stocks, portfolios 3-5 represent mid-caps and portfolios 6-10 represent small caps.
The Real Return is the annual percentage return realized on an investment adjusted for inflation. Trend, according to Price Matters® is the slope of an exponential growth function that closely tracks a real (inflation-adjusted) long term Index for that Asset Class. Distance from Trend is the distance of the trend line relative to the current index level expressed as a percentage.
High-yield securities (including junk bonds) are subject to greater risk of loss of principal and interest, including default risk, than higher-rated securities.
Treasury inflation-protected securities (TIPS) are a type of Treasury security issued by the US government. TIPS are indexed to inflation in order to protect investors from a decline in the purchasing power of their money. As inflation rises, TIPS adjust in price to maintain its real value.
A real estate investment trust (REIT) is a company that owns, operates, or finances income-generating real estate. Modeled after mutual funds, REITs pool the capital of numerous investors. This makes it possible for individual investors to earn dividends from real estate investments—without having to buy, manage, or finance any properties themselves. There are special risks associated with an investment in real estate and Real Estate Investment Trusts (REITs), including credit risk, interest rate fluctuations and the impact of varied economic conditions.
Definitions:
For each outcome category (accumulate, sustain and distribute) RiverFront’s portfolio management team has assigned one or more RiverFront product(s) based on their assessment of the product’s investment objective as it relates to a typical client’s return and risk objectives when seeking investment outcomes of accumulating wealth, sustaining wealth and distributing wealth. The team has also designated RiverFront product alternatives for those clients looking to take more or less risk with the outcome category. The ‘more aggressive’ (or more risk) alternatives will generally have greater equity and international exposure as well as longer time horizon targets, while those designated as ‘more conservative’ (or less risk) will have fewer equities, a lower exposure to international and shorter time horizon targets. Since the risk assessments are dependent on the outcome category selected, RiverFront products may fall in multiple categories. All investments carry a risk of loss and there is no guarantee that an investment product or strategy will meet its stated objectives.
RiverFront’s Price Matters® discipline compares inflation-adjusted current prices relative to their long-term trend to help identify extremes in valuation.
Interest rate sensitivity is a measure of how much the price of a fixed-income asset will fluctuate as a result of changes in the interest rate environment. Securities that are more sensitive have greater price fluctuations than those with less sensitivity. This type of sensitivity must be taken into account when selecting a bond or other fixed-income instrument the investor may sell in the secondary market. Interest rate sensitivity affects buying as well as selling.
RiverFront Investment Group, LLC (“RiverFront”), is a registered investment adviser with the Securities and Exchange Commission. Registration as an investment adviser does not imply any level of skill or expertise. Any discussion of specific securities is provided for informational purposes only and should not be deemed as investment advice or a recommendation to buy or sell any individual security mentioned. RiverFront is affiliated with Robert W. Baird & Co. Incorporated (“Baird”), member FINRA/SIPC, from its minority ownership interest in RiverFront. RiverFront is owned primarily by its employees through RiverFront Investment Holding Group, LLC, the holding company for RiverFront. Baird Financial Corporation (BFC) is a minority owner of RiverFront Investment Holding Group, LLC and therefore an indirect owner of RiverFront. BFC is the parent company of Robert W. Baird & Co. Incorporated, a registered broker/dealer and investment adviser.
To review other risks and more information about RiverFront, please visit the website at riverfrontig.com and the Form ADV, Part 2A. Copyright ©2023 RiverFront Investment Group. All Rights Reserved. ID 2759952
