
By Mark Keller, CFA, Bill O’Grady, and Patrick Fearon-Hernandez, CFA
Summary of Expectations:
- A recession is highly probable in 2023. Our base case is a garden-variety recession.
- Three factors could trigger a deep recession:
- Falling nominal home prices
- A financial crisis
- A geopolitical event
- One factor that could mitigate the downturn is investment spending, especially on manufacturing plants and equipment. Manufacturing has been depressed for over three decades and the prospect for reshoring and building redundancies could support the economy. We suspect this factor will tend to be longer term in nature, but it could begin next year.
- We expect inflation to ease in 2023, but the Federal Reserve’s preferred narrative on inflation control and how inflation was quelled in the 1970s could increase the odds of a policy mistake.
- Long-duration Treasuries are signaling faith that the FOMC will curtail inflation even at the cost of a deep recession. This faith has led to a deep inversion of the yield curve.
- Credit spreads are expected to remain well behaved.
- This good behavior is mostly a function of the short business cycle, which has not been long enough to support the usual deterioration of credit standards.
- Increasing concerns about market liquidity are a risk to the Treasury market. The liquidity issues may signal that the size of the deficit is too large for the current auction distribution system. Either the system needs to be reformed or the deficit reduced.
- Strictly based on our modeling, our S&P 500 operating earnings forecast for 2023 is $179.61 with a year-end multiple of 17.1x. However, remaining excessive liquidity and the usual rise in the multiple during recessions increase the odds that the multiple will offset the expected decline in earnings. Depending on the depth of the recession, a decline in the market to 3520-3071 is possible, and as we note below, from there, a recovery to the 4100-4300 range is likely. Obviously, the key to equity market behavior is the timing of the recession and Fed behavior.
- We expect small caps to outperform, although this outperformance will likely be tempered by the recession.
- Value is expected to outperform Growth.
- Although U.S. markets may outperform in the first half of 2023, the relative outperformance of U.S. stocks will occur in the very late innings. We look for dollar weakness to develop over 2023, which will tend to be supportive for foreign stocks.
- Although we are bullish long-term on commodities, it is common, even in secular bull markets, for prices to decline during recessions. We expect to maintain modest positions in commodities, but as the dollar weakens next year, commodities should benefit. An economic recovery will support commodities as well. Again, the timing of the downturn is important.
The Economy
Our Outlook reports always begin with an answer to the question: “Will there be a recession in the upcoming year?” Most years, the answer is “no,” or perhaps “maybe.” This year, however, the answer is a nearly unqualified “yes.” Last year, we discussed how the economy was being hit by unusual events such as the war in Ukraine and the onset of tighter monetary policy in response to very high inflation. Coincident economic data signals that the economy isn’t in recession quite yet, but many leading indicators suggest that the economy will enter a downturn sometime in 2023.
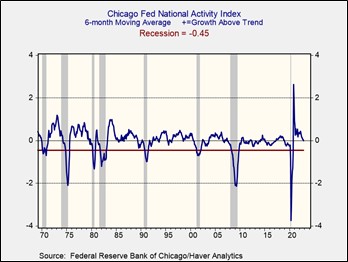
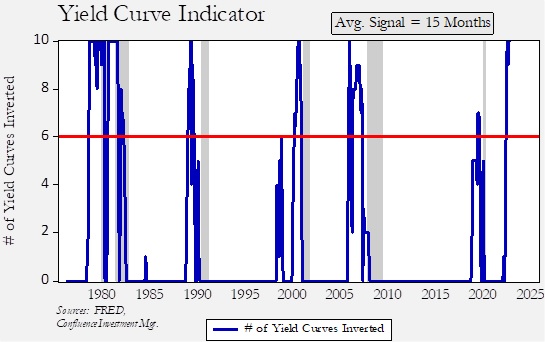
This first chart shows the Chicago FRB’s National Activity Index. It is a broad-based measure of the economy where a reading of zero suggests an economy growing on trend. Currently, the indicator (which we smooth with a six-month moving average) suggests the economy has retreated to trend after being above-trend for most of 2022. A reading of -0.45 is consistent with recession. What is signaling a downturn? The most reliable of leading indicators, the yield curve, has been signaling a downturn for several months. However, one of the issues with this indicator is that there is a multiplicity of yield curves. To address this issue, we have developed an indicator that monitors 10 different yield curves. According to this indicator, we are well into recession territory.
Historically, when more than six of the curves invert, the economy enters a recession, on average, within 15 months, with the longest episode occurring 19 months after inversion and the shortest eight months afterward. The signal was triggered in July; therefore, using these figures, on average, we should expect a recession in early Q4 2023. However, it might occur in 2024 or it could happen as early as Q1 2023.
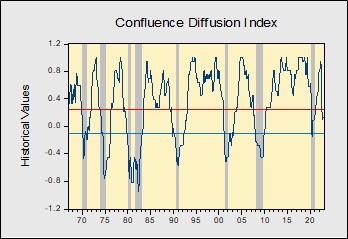
Finally, our very own business cycle indicator has signaled a recession, with the most likely start in the first half of 2023 (H1 2023).
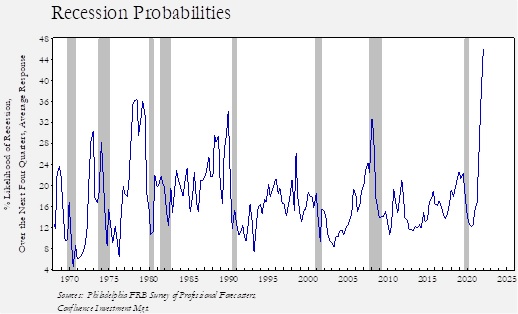
Although economists have been criticized for years for their inability to predict recessions, recent surveys do suggest a record-high plurality calling for a downturn. The Philadelphia FRB has conducted a survey of economists since 1968, which collects expectations about the economy, interest rates, inflation, etc. One of the factors surveyed is the likelihood of recession over the next 12 months. The current expectation is the highest on record.
While the economists in this survey have never achieved a majority of participants predicting a recession, for the most part, a reading above 30% has tended to correctly signal a downturn. We are clearly in that territory now.
As we noted above, in a normal year, the question we face is, “recession or not?” In a year where a recession is highly likely, the pertinent question is, “normal or deep?” Unfortunately, there is no widely accepted metric for determining the impact of a recession, but there are some that offer clues. Since 1960, a reading of the Sahm Rule1 over two is consistent with a deep recession.
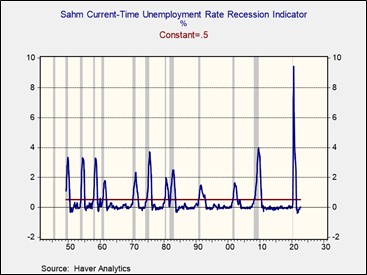
By this measure, the 1970, 1973-74, 1981-82, 2007-09, and 2020 recessions were all deep downturns. The 1960, 1990, and 2001 recessions were not.
The base case is that recessions will be normal until proven otherwise. In general, the deep recessions tended to have a complicating set of circumstances. For example, the 1970 recession had the Vietnam War. The 1973-74 recession was impacted by the Arab oil embargo, whereas the one in 1981-82 was affected by unusually tight monetary policy. The 2007-09 recession was the Great Financial Crisis, and the 2020 downturn was caused by the pandemic.
As to whether the likely upcoming recession will be a deep one, there are three potential factors that could cause a deeper downturn.
The first factor is residential real estate. Residential housing has multiple avenues of influence on the economy. Homebuilding boosts economic activity. This next chart shows a model that measures the relationship of the National Association of Homebuilder’s Index, which measures general homebuilding sentiment, to the unemployment rate. The model is projecting a sharp rise in unemployment by late next year.
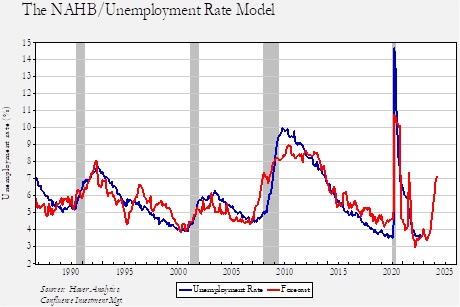
Even buying existing homes tends to trigger follow-on purchases of furniture and furnishings. Additionally, the home is the largest asset for most households, so home prices tend to have a wealth effect.
The pandemic created a myriad of conditions that conspired to send home prices significantly higher. First, many businesses shifted to work-from-home arrangements, so workers, finding themselves stuck at home, decided that larger living spaces were necessary, which prompted buying activity. Low interest rates encouraged home-buying as well. Using the S&P CoreLogic Case-Schiller Home Price Index, home prices rose 44.6% from the onset of the pandemic in February 2020 to June 2022, the fastest 26-month rise in the index’s history.
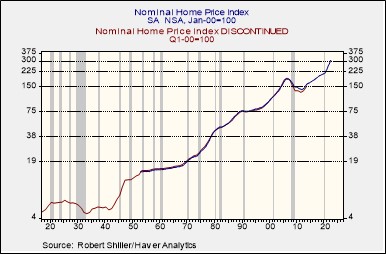
This chart melds two series from Robert Shiller, an annual series that began in 1901 and a monthly series that began in 1953. We have log-scaled the data, and what it indicates is that sustained nominal declines in home prices are rare. There was a decline of 30.6% from 1925 to 1933, an 8.4% drop from 1940 to 1941, and a 31.8% fall from 2006 to 2011. Two of the three periods of falling nominal home values ended up with historically deep recessions.
The runup in home prices was a collateral effect from the policy response to the pandemic. The rise in prices was significant, but a major decline may not occur. We note that housing starts had risen to high levels before each price peak, suggesting that a supply overhang had developed. In this price shock, homebuilding did rise, but from depressed levels, meaning that we never saw starts reach levels seen in 2005-06. Thus, we suspect we will see stagnant nominal prices but avoid a major decline.
The second factor that may trigger a deep recession would be a rapid deterioration in financial conditions.

This chart shows the Chicago FRB’s National Financial Conditions Index, where a reading of zero shows normal conditions, while any number less than zero implies favorable conditions. The deep recessions of 1973-75, 1980-81, and 2008 were characterized by high levels of financial market stress. Financial market fragility is difficult to spot in advance, and financial conditions can go from calm to crisis in short order as this chart shows, especially since 1990. We have seen conditions deteriorate since the FOMC started tightening. So far, no crisis has emerged, but that doesn’t mean one can’t occur at some point in the future.
One signal that does show when stresses may be elevated is the spread between the fed funds target and the implied interest rate on the two-year deferred Eurodollar futures.
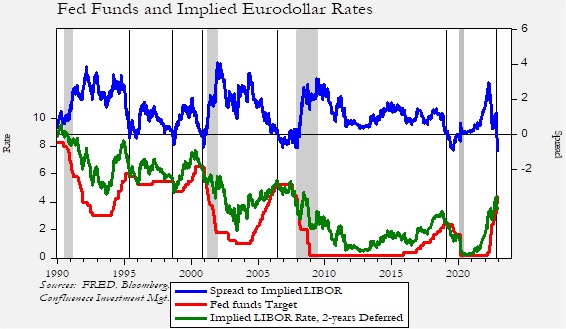
The lower lines on this chart show the fed funds target and the implied LIBOR rate from the two-year deferred Eurodollar futures. The upper line is the spread between the two rates. We have placed vertical lines to designate when the spread inverted. When this inversion occurs, it suggests funding markets believe that the policy rate is at least neutral and is becoming tight. The spread has recently inverted, suggesting that financial markets believe the FOMC has “done enough.” If the FOMC continues to tighten, and the futures implied rate doesn’t rise, financial stress could also rise.
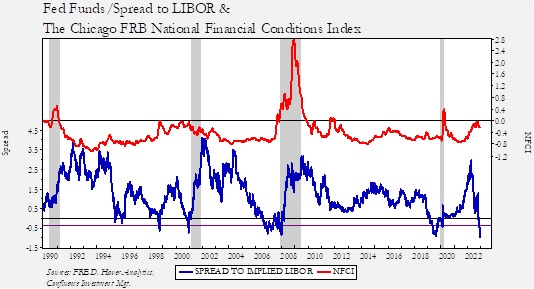
The blue line on this chart shows the spread between the fed funds target and the implied LIBOR rate from the two-year deferred Eurodollar futures from the above chart. The red line is the Chicago FRB’s National Financial Conditions Index (NFCI). When the implied interest rate spread falls below -40 bps, there is an increased chance of a major financial event, as shown by a spike in the NFCI. There is usually a delay of at least six months before the crisis is triggered. This tells us that we are not in any great danger yet, but the odds of a crisis will rise if the FOMC continues to raise rates.
Third, a geopolitical crisis could occur. There are multiple candidates for such an event, and anytime an active war is underway, the chances are elevated. We publish a separate geopolitical outlook in our Bi-Weekly Geopolitical Report series, thus we refer readers to our recent report for a more in-depth examination of the geopolitical issues we expect to arise in the coming year.
Overall, if a deep recession is in the offing, the most likely triggers will be a geopolitical event, a drop in home prices, or a financial event. We will continue to watch these factors carefully, but our base case remains a “normal” recession.
One factor that could support a modest downturn is investment. As the nature of global integration changes and production is reshored, investment should rise. Russel Napier made this point in a recent interview. If we look at real investment in structures and industrial equipment, the data shows a clear uptrend from 1950 to 1984 and a flatter trend thereafter.
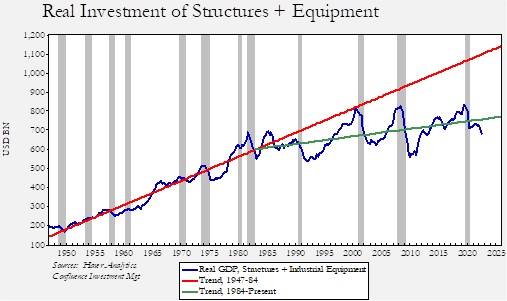
The compound annual trend growth rate (CAGR) of real structure and industrial equipment from 1947 into 1984 was 3.9%. Since then, the CAGR is a mere 0.6%. Although rebuilding the U.S. industrial base will be a multi-year project, if this sort of investment begins in the near future, it may ease the magnitude of the recession.
Manufacturing activity tells a similar story.
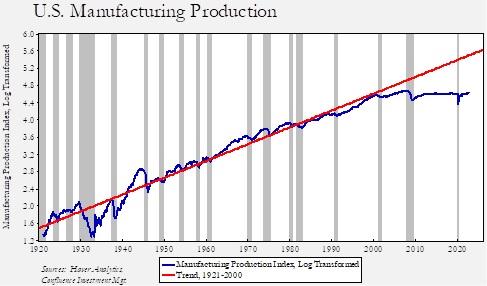
This chart shows the U.S. Manufacturing Index, log scaled, with a time trend. After WWII, manufacturing tended to rise on-trend or, as shown from 1960 to 1980, a bit above-trend. However, manufacturing moved below-trend following the end of the Cold War and has languished since China entered the WTO. As noted above, reshoring and the focus on securing supply chains should lead to a renaissance in U.S. manufacturing. As this chart suggests, a return to trend would be a significant boost for the U.S. economy. Although we doubt it will prevent a recession, it could reduce the effect.
In summary, we are expecting a “normal” recession, but given the host of problems that could emerge, the odds of a deep downturn are not insignificant. The path of the recession will impact how financial markets fare in the upcoming year.
Inflation and Monetary Policy
It is only recently that we have had to focus on inflation, since inflation was mostly steady for most of the past 27 years.
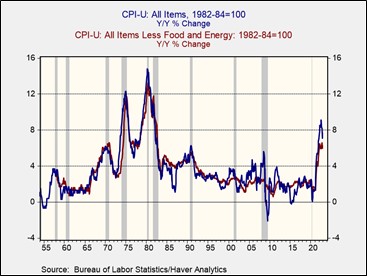
The current spike in inflation is similar to what the economy experienced in the 1965-80 period. As those earlier periods show, inflation does tend to fall when recessions occur. What policymakers are trying to avoid is a repeat of the cycles that arose during those periods, when the FOMC would raise rates as inflation accelerated, triggering a recession. However, the chart shows that as policy was eased in response to the recession, inflation would soon return with greater intensity.
The generally accepted narrative was that this pattern of higher highs and higher lows occurred because monetary policy wasn’t austere enough to offset inflation expectations. Essentially, Paul Volcker decided to allow interest rates to find their own level and target money supply, leading to a massive upward rise in interest rates. By making it clear that the Fed was willing to force great pain on the economy, the inflation psychology that caused the uptrending pattern was broken, leading to the “great moderation” of inflation rates.
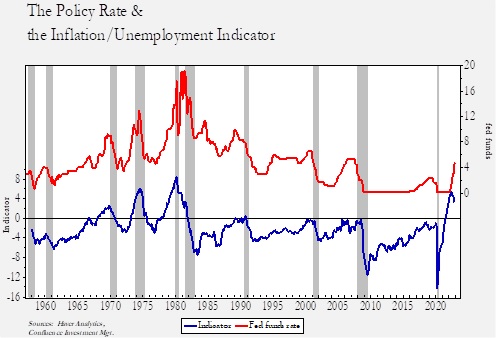
This chart outlines how this narrative developed. The upper line shows the nominal fed funds rate, and the lower line indicates the difference between the yearly change in CPI less the unemployment rate. In the late 1960s, the lower line rose above zero, meaning that CPI was higher than the unemployment rate. In each recession, the FOMC managed to bring down inflation and raise unemployment enough to generate a negative spread. However, shortly after policy was eased to counteract the recession, the indicator would rise into positive territory again (CPI > unemployment), triggering another round of policy tightening and another recession. Finally, Volcker raised rates and kept them elevated for long enough to break the inflation psychology and end the scourge of inflation from the land!
After Volcker, the FOMC tended to raise the policy rate preemptively whenever the CPI/unemployment spread narrowed to about -1%. The idea was that by moving preemptively, inflation psychology could be contained. This policy guide remained in place until recently. The pandemic recovery triggered a rapid widening of the CPI/unemployment spread into positive territory for the first time in over four decades. Thus, by this framing, the FOMC had made a serious policy mistake, risking a return of inflation psychology.
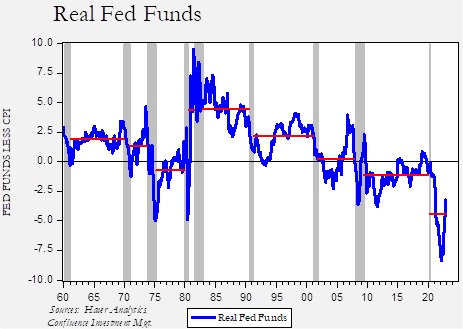
This chart highlights the issue. We have averaged the real policy rate (rate less yearly CPI) over each expansion. Volcker clearly lifted the policy rate into elevated positive territory and positive average rates were seen in the following three business cycles. During the previous expansion, the policy rate had a negative average, although it did turn positive for a couple episodes. Still, we have never seen a real policy rate at this level of negativity over the above time frame.
Based on this analysis, the FOMC is risking a return to the 1970s inflation rate by not moving aggressively enough to contain inflation expectations. Chair Powell clearly does not want inflation expectations to return on his watch, so in his statements and speeches he continues to signal that policy tightening will continue. It is likely the chair realizes that this policy will result in a downturn, but if he believes in the above narrative, then he should take interest rates higher. Other factors may intervene and prevent Powell from imitating Volcker, but until they do, expecting a pivot ignores the Federal Reserve’s institutional narrative of how inflation was previously contained.
Although this narrative is dominant, it doesn’t fully explain the drop in inflation after 1980. While Volcker was implementing monetary austerity, the Carter and Reagan administrations were actively deregulating the economy. Regulations on transportation, anti-trust, and financial services were reduced.
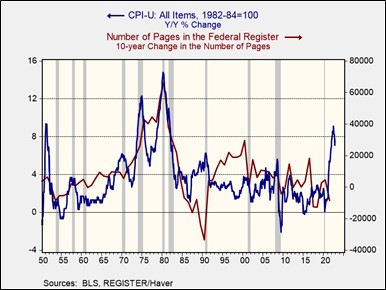
This chart shows the yearly change in CPI with the 10-year change in the number of pages in the Federal Register. Entries into the Federal Register generally reflect government activity. It is rather obvious that the trend in inflation tended to track with regulatory activity, and a reduction in regulatory activity was coincident with falling inflation.
Taxes were cut.
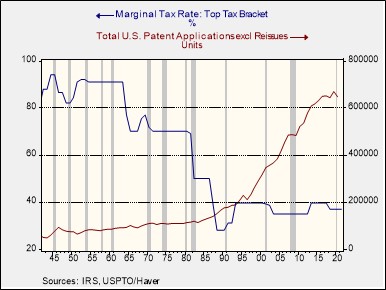
This chart shows the highest marginal tax rate overlaid with patent applications. Note that applications rose steadily after the tax rate was cut. In general, patents represent ideas being brought to market. Cutting taxes, along with reducing regulation, meant that entrepreneurs could (a) be free to try out new products and technology, and (b) keep more of the revenue from those activities. The rapid adoption of new technology and new techniques expanded supply.
International trade was fostered and expanded. As the trade deficit became persistent, inflation declined.
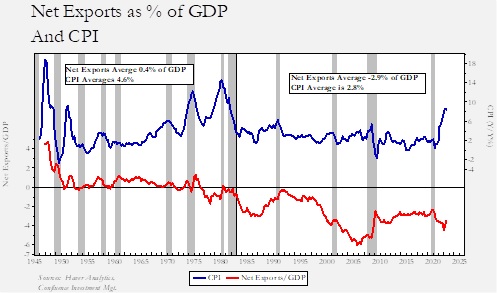
This chart shows that from 1947 into 1983, net exports to GDP averaged +0.4%. Essentially, the U.S. ran a balanced trade account and inflation averaged 4.6%. After 1983, net exports went into perennial deficit, averaging -2.9% of GDP, and inflation averaged 2.8%. The decline in average inflation coincided with trade deficits as the U.S. was essentially able to tap world productive capacity, which pressured labor and kept inflation under control. In other words, globalization moderated goods inflation.
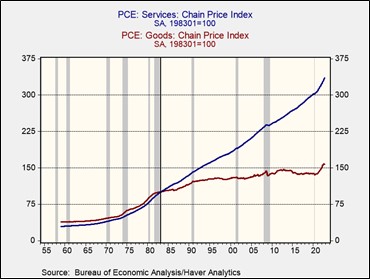
This is obvious in the difference between goods and services deflators. Goods can more easily be substituted in trade compared to services. Since 1983, the compound annual growth rate of goods inflation is 1.2% compared to the services inflation growth rate of 3.1%.
Here is where the inflation path becomes tricky. There was a debate in the early part of the recovery as to whether the inflation we were seeing was transitory or longer lasting. The transitory argument maintained that temporary supply issues were causing inflation, and as these problems eased over time, the price spike would resolve itself without intervention. The other side of the argument claimed that monetary and fiscal policy was overly stimulative and only through austerity could inflation be contained. It is clear that the second case has won the day as inflation has remained stubbornly high. The FOMC has aggressively raised interest rates, but with inflation still well above unemployment, additional rate hikes appear inevitable.
However, there was an element of truth to the transitory argument. An important component of rising inflation was the disruption of supply chains, although it was the point about supply chains healing that was misguided. Yes, supply chains have partly recovered, but the pandemic, the war in Ukraine, and the breakdown in relations between the West, China, and Russia have changed global supply chains.2
Sometimes when you have two complementary factors occurring simultaneously, a condition known as multicollinearity develops. This means that both factors likely contributed to the same outcome, but it may be difficult, if not impossible, to determine which one was the most important. In other words, we know inflation fell and was stable from 1983 to 2020, but we don’t know if the critical factor was monetary policy or deregulation/globalization. Even though trade remains at high levels, several events have changed supply chains, perhaps permanently.
- The pandemic revealed that many critical supplies had a single point of failure. In the three decades after the Cold War, firms focused almost solely on efficiency and were willing to assume supply risks were negligible. The pandemic proved that a closure at a particular point in the supply chain could reduce supply to zero. Since efficiency rendered inventory and redundancy as unacceptable costs, firms, governments, and households faced widespread shortages. Even with most of these shortages resolved, the need for redundancy and stockpiling has been proven. Redundancy and inventory accumulation will raise costs.
- The idea that the world would adopt the Washington Consensus had relegated security concerns to be sublimated to efficiency. Over the past decade, though, U.S. administrations have gradually realized that many important nations were not marching toward democracy and capitalism, and geopolitical conflicts were not evaporating. Thus, Europe’s dependence on oil and natural gas from Russia shifted from a defensible supply relationship to a security risk. Putting the most sophisticated semiconductor foundries within range of China’s short-range missiles was found to be an unacceptable risk. Building redundancies into technology hardware and energy will be very costly.
- Discovering that the West has formidable enemies means that national security may trump commercial interests. The ideas of “friend-shoring” and “reshoring” are forms of industrial policy that aren’t focused on efficiency but rather safety and resiliency.
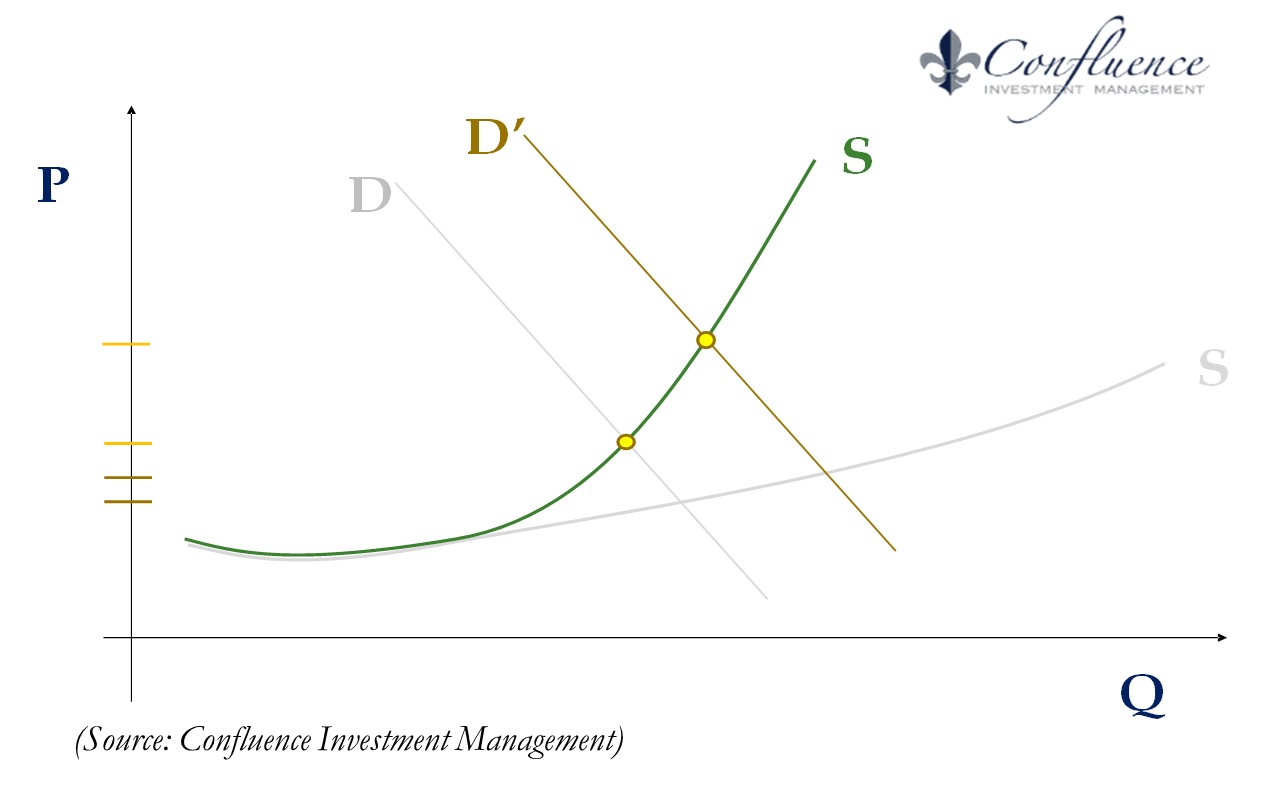
Under conditions of globalization, the aggregate supply curve is flat, represented on this chart as the gray S-curve. Increases in demand have a negligible effect on price levels. We believe we are shifting to a steeper supply curve, shown as the green S-curve, which means that rising demand will not only bring higher inflation but more volatile inflation as well. If the flat supply curve is the primary reason why inflation has been kept under control until recently, then the FOMC’s quest to quell inflation expectations may not be material. In other words, regardless of the conduct of monetary policy, we are likely heading toward a world of higher and more volatile inflation.
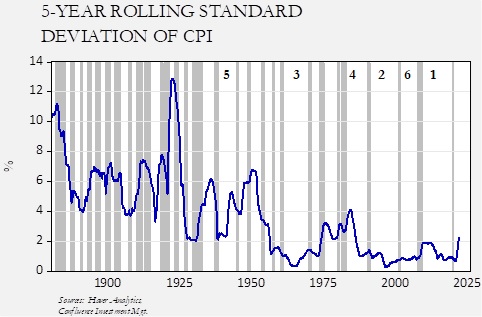
This chart shows the five-year rolling standard deviation of the yearly change in CPI starting in 1875. We have recently experienced the longest period of sub-2% deviation in history. Also, since the mid-1980s, we have enjoyed four of the six longest expansions in our history. Rising inflation volatility means more rapid policy cycles and shorter business cycles.
Our fear is that the FOMC, tied to the narrative that quashing inflation expectations is necessary to prevent higher inflation volatility and a repeat of the 1970s, may overtighten policy but still won’t avoid a future of higher inflation and shorter business cycles. This is because the real cause isn’t bad monetary policy (although it is arguably bad, considering prudence would dictate that deeply negative real policy rates should be avoided), but rather the issue is a steeper supply curve. The resolution is supply-enhancing policy, though unfortunately deregulation and globalization have become socially and politically unpopular, making it difficult to implement such policies. If anything, we are more likely to see re-regulation and deglobalization.
Although this probably won’t be a serious issue in 2023, it could become a major problem in later years. If we are correct that the Volcker narrative has captured the FOMC, the committee will view a return of “stop/go” as a sign that policy wasn’t tightened enough! A steeper aggregate supply curve means that when policy is eased (the Fed pivots), inflation will return rapidly as growth recovers. If the FOMC sees this outcome as a failure, it will tighten more aggressively in subsequent cycles, assuming that conditions are similar to 1980. Our take is that, in reality, the shape of the supply curve means that low inflation is only possible if economic growth is slowed permanently. Since that outcome isn’t politically viable, higher sustained inflation is the likely outcome until the supply issues are addressed.
Since we expect a recession to occur in the next year, inflation should fall as well. A CPI model built on the ISM supply component from both the goods and services index suggests that inflation should fall to around 5.5% by mid-2023.
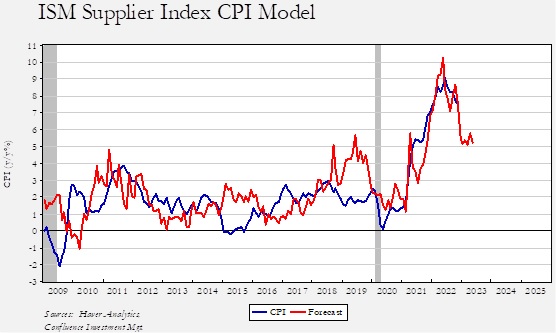
That level of inflation is in range with the current unemployment rate. Assuming the unemployment rate rises to around 6% by the end of 2023, a fed funds level of 4.50% would be consistent with neutral policy. This is why the FOMC continues to signal that rate cuts will come slowly. Given the presumed pace of declining inflation and slowing economic activity, easing will likely be measured.
Financial and Commodity Market Expectations
The so-called “Fed pivot” is likely a key to the reason financial markets have held up so well despite widespread expectations of a recession. For the past 30 years, because inflation was low, central banks have been attuned to financial stress. Thus, when stress rose, monetary policy was eased aggressively. The lesson learned by investors is that one should “see through” the downturn because the recovery in asset prices is so rapid that it’s almost impossible to capture it once it begins. However, we have never seen a pivot under conditions of elevated inflation. If the pivot occurs, it could result in a loss of faith among long-duration fixed income investors over whether the Fed can contain inflation. That loss of faith could trigger widespread financial instability that might be hard to manage. The other feature that investors may have miscalculated is that the central banks have tended to rely on aggressive rate cuts and balance sheet expansions to address financial stress. However, in March 2020, the FOMC used other tools, such as creating backstops in various markets to ensure that liquidity could still be had, though at a penalty rate. It is quite possible that the Fed may not move rates very much and will instead address stress by ensuring that trades can occur at “some” price. Thus, the expectation that the pivot will come with aggressive rate cuts could be misplaced.
The Fed and other central banks are truly caught in a difficult spot as easing prematurely might embed inflation expectations, whereas tightening enough to bring down inflation to target levels may trigger financial turmoil. Investors should be aware that a pivot might not be a bullish event.
In this section, using the above analysis, we postulate the impact on financial and commodity markets.
Fixed Income
At the beginning of 2022, the 10-year T-note yield was 1.63%, but by October 24, the yield had reached 4.25%. To a great extent, the Treasury market may be where we can see the starkest expression of inflation expectations. Finance postulates that a risk-free bond’s nominal rate is the expected real rate plus inflation expectations. Until the issuance of inflation-protected notes (TIPS), determining inflation expectations was merely a guess. Surveys exist, but they generally don’t seem to do a good job of estimating actual inflation or expectations. Since TIPS were created, estimates of the real yield could be divined by measuring the spread between nominal T-notes and TIPS.
However, in recent months, there has been a major divergence between the ex-post real yield3 and the TIPS yield.
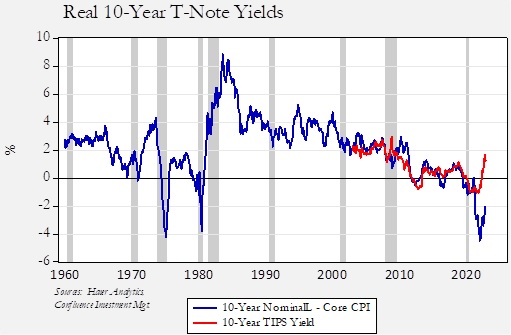
What can justify this divergence? It suggests that bond investors have great faith that inflation is going to fall in the coming years. Thus, the current high rate of inflation, which has led to the weakest real yields in over 60 years, is being mostly ignored.
Is this faith justified? Perhaps, but the employment/inflation chart above suggests that the FOMC will need to tighten enough to both raise unemployment and ease inflation. We do expect both to occur in the coming months. But as the TIPS chart shows, we haven’t seen a divergence of this magnitude before, and although we could see some decline in the TIPS yield, most of the gap between the TIPS yield and the ex-post yield will need to come from the latter. So, either inflation needs to decline significantly, or nominal yields will need to rise.
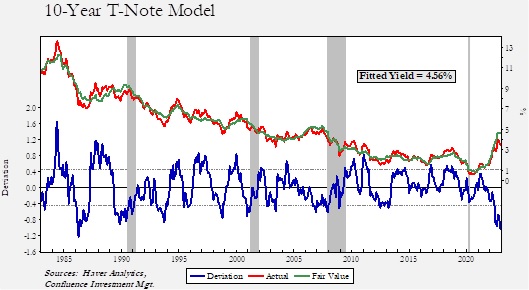
Our T-bond model suggests that yields are too low relative to the fundamental factors. However, much of this divergence can be explained by the inversion of the yield curve. 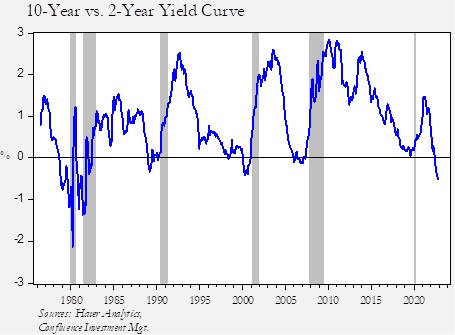
The current inversion is unusually deep, meaning the market is signaling that monetary policy is expected to bring down inflation, and thus, long-duration yields are not moving as much as the policy rate would suggest it should.
Investors should keep in mind that the downtrend in yields, which has been in place for over 35 years, appears to have been definitively broken.
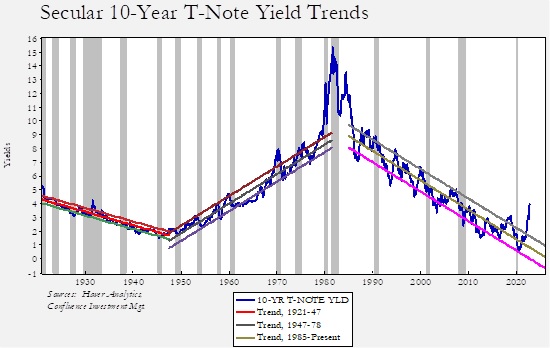
The above chart shows 10-year T-note yields beginning in 1921. We have placed trend lines with standard error bands over various periods. No bands were created for the “blow-off top” in the early 1980s. As the chart shows, secular downtrends and uptrends tend to last decades. Definitive breakouts should not be ignored. The last major downtrend, which ended around 1947, led to years of gradual rate increases. We don’t know if something similar will occur this time around. History would suggest that yields do fall in recessions, but we expect a new band to evolve, and it’s likely that the lows established during the pandemic will be enduring.
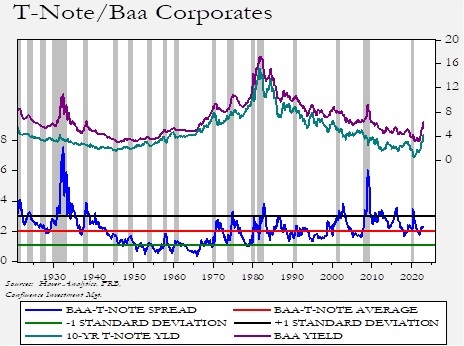
Credit spreads have been remarkably well behaved. In investment-grade, spreads remain near their long-term averages and well below levels usually associated with recessions.
High-yield spreads have been remarkably restrained as well.
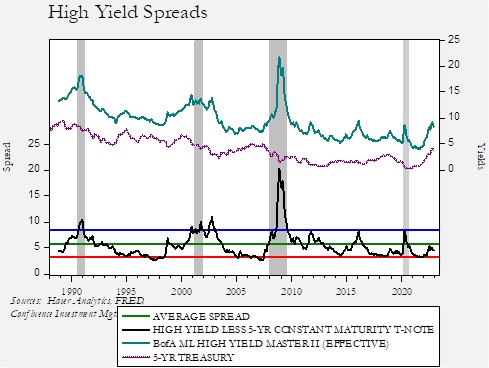
Why are spreads so well contained? We suspect there are two reasons. First, since the economy was in recession recently, the expansion hasn’t gone on long enough to allow poor credit practices to emerge. In recent decades, due to expansions lasting a long time, investors would become complacent and accept less stringent credit terms. Low interest rates exacerbated that activity. Second, much of the risky behavior has moved to the leveraged loan market, leaving traditional investment-grade and high-yield markets with better credit quality.
The key for fixed income is whether monetary policy will succeed in bringing down inflation without a deep recession. As noted above, we have some doubts that this will be the outcome, but markets represent the preponderance of opinion. The risk to watch for is if the FOMC declares victory over inflation before achieving its 2% target on core PCE. If that occurs, we would expect a bear steepening (both long and short rates rise, but long rates rise faster) and wider stress.
One area of particular concern is the lack of liquidity in the Treasury market. There are a number of causes, with one being its sheer size. The total Treasury market is $23.5 trillion, the fourth largest asset market in the U.S. Residential real estate and equities are at least twice as large, and commercial real estate is about the same size; however, all three of those markets are heterogeneous. Treasury paper is uniform, with the primary difference being duration. For most of history, the market was deep and liquid, making Treasuries an ideal financial instrument. Not only are Treasuries the premier global reserve instrument, but they are also often used in collateralized lending (“repo”), the primary lending instrument in the non-bank financial system. There have always been fears that something could change that fact, and foreign selling, hyperinflation, or default has always been a concern, but in reality, a crisis stemming from these events was very unlikely.
But now, given the market’s size, there are increasing reports that “off-the-run” Treasuries are becoming hard to trade. If these less-traded instruments were to become illiquid, their value as the global risk-free asset would be undermined with uncertain effects for the world financial system. What sorts of problems could develop? Imagine a situation where an off-the-run instrument is used as collateral. A party in the transaction realizes that the value of the instrument is lower than one would expect due to the lack of liquidity. The party advantaged in the transaction would have an incentive to “give” the disadvantaged party the loss by not actually returning the bond but forfeiting the collateral. As other repo lenders learn of the issue, spreads would widen, and lending would slow or potentially stop. In March 2020, the Treasury market became dangerously illiquid, in part due to the pandemic. The Fed stepped in to provide liquidity and calmed the situation.
Perhaps the best way to look at this liquidity issue is that the system to manage Treasury borrowing, designed by William Martin (Fed chair, 1951-70), needs to be revamped. The current system established primary dealers who were expected to be isolated from the commercial banking system. These dealers were tasked with ensuring that all bonds the Treasury wanted to issue would be purchased. Thus, after the public (domestic and foreign) bought the auctioned bonds, the dealers would buy what was left and sell them into the markets post-auction. These dealers may simply not be big enough to manage the current level of borrowing. It is important to note that the repo market was supported by Martin as primary dealers use bond inventory to lend and borrow. Martin’s goal was to create a lending system outside of the commercial banking system in order to create a less regulated and more efficient lending sector.
Regulators are working on market reform. One proposed solution would be to create a central clearinghouse. Another would be to loosen rules on banks, allowing them to hold more Treasuries without committing capital. Unfortunately, there are multiple regulators and participants in the Treasury markets that make any reforms difficult; after all, one party’s reform can often look like punishment to another party.
So, how should investors think about this situation? The problem of Treasury liquidity isn’t necessarily due to the size of the deficit itself, but rather the issue resides with our system of trading not being scaled to the current size of the deficit. Creating a system that is able to manage larger debt levels is the most likely outcome. Unfortunately, history tells us that solutions often only occur during crises. This is because a crisis forces a solution, one that may advantage one group over another. Such a solution isn’t possible in peacetime because of objections from those who would be disadvantaged. We are including this information because financial stress usually rises in tightening cycles and the liquidity situation in Treasuries could become a problem at some point. We do expect a solution to be implemented, but something may need to “break” in order to create the political conditions for such a solution.
Our forecast for the 10-year T-note is a modest decline in yields to 3.30% due to the recession. However, given all the uncertainties surrounding inflation, geopolitical concerns, and market structure, volatility will likely remain elevated. A range of 4.75% to 3.00% is possible.
Equities
We focus on the S&P 500 for our forecasts and discuss different capitalizations and foreign stocks relative to that key index. We begin with earnings. We build our earnings forecast using total S&P 500 earnings (as opposed to earnings per share) scaled by nominal GDP. Our model uses net exports/GDP, credit spreads, national income and product account (NIPA) after-tax profits/GDP, the dollar, oil prices, and a binary recession variable.
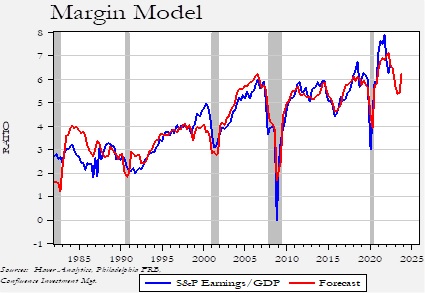
Given our expectations of a recession next year, we are looking for a decline in profits. Our forecast for next year’s S&P 500 profits is $179.61.
We offer one word of caution regarding this chart. As we show below, the end of the Cold War led to an expansion of multiples. The same is true with profit margins. Although we don’t show it on the this chart, S&P 500 profits tended to range from 2% to 3% of GDP from 1965 (when the data was first calculated for the entire index) into 1990. However, since the early 1990s, profit margins have not just been elevated but have been steadily rising, with extreme volatility around recessions. If our thesis is correct that the post-Cold War order is over, then it would not be unreasonable to expect a secular decline in margins, perhaps not to Cold War levels, but lower than what we see currently. That process probably doesn’t occur at this recession, but we may not see the usual margin recovery post-recession.
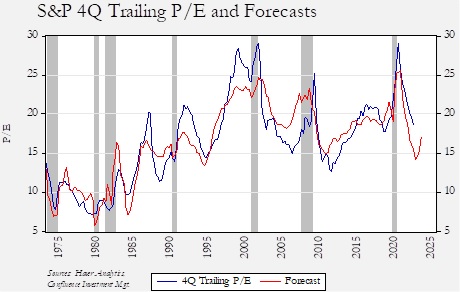
Next, we address the price/earnings (P/E) multiple.
Our model uses both CPI and the five-year standard deviation of the yearly change, fed funds, yearly M2 growth, the fiscal deficit, 10-year T-note yields, retail money market fund levels, and a recession binary variable. The model suggests that the multiple will come under pressure in 2023 but it should recover as inflation eases, rising to 17.1x (12-month trailing) by year’s end.
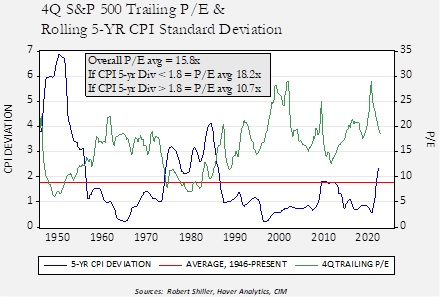
Although it is well established that rising inflation usually leads to contracting multiples, we also find that rising inflation volatility has a similar depressing effect.
The below chart shows the four-quarter trailing P/E since 1950. The average multiple over that time frame is 15.8x. Overlaying the multiple is the five-year rolling standard deviation of the yearly change in CPI. There is an inverse relationship between the two series. When inflation volatility is less than 1.8%, the multiple averages 18.2x. If greater than 1.8%, the multiple declines to an average of 10.7x. It is our assumption that the aggregate supply curve will steepen as deglobalization develops and will almost certainly result in inflation volatility.
Finally, a new “cold war” will likely lead to a lower multiple. A divided world will tend to reduce efficiency and increase inflation. If we observe the multiple during the Cold War relative to the post-Cold War period, the differences are obvious.
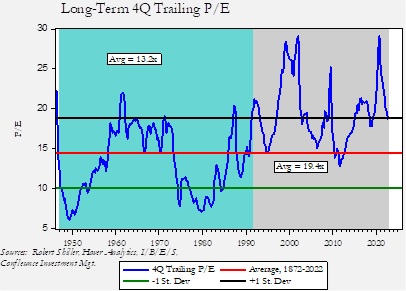
The average and standard deviations are calculated over a very long time frame. During the Cold War, the multiple for the S&P 500 tended to fluctuate around the long-term average. However, since the end of the Cold War, the multiple rarely fell below the long-term average and instead moved to unusually elevated levels. As the world shrinks, it would be reasonable to assume multiple compression in the coming years.
So, where does this put us? For 2023, assuming $179.61 in earnings with a 17.1x multiple yields a forecast of 3071.33. The multiple forecast model has a standard error of 2.5x, which would generate a range of 2622.31 to 3520.35, although we expect a bias toward the upside due to net saving inequality (see below). Recession years are usually volatile years for the market, thus our expected range for next year during the recession is 3520.35 to 3071.33. If the recession ends next year, which is probable, a recovery back to the 4100 to 4300 range would be expected. In recent cycles, we have seen that equities tend to react strongly to monetary policy easing, assuming we avoid one of our three “deep-recession” scenarios. Additionally, as we note below, a supportive factor for equities is high liquidity among the portion of the population most inclined to own stocks.
As this next chart shows, the top 10% of households, who hold most of their assets in equities, have a strong cash position.
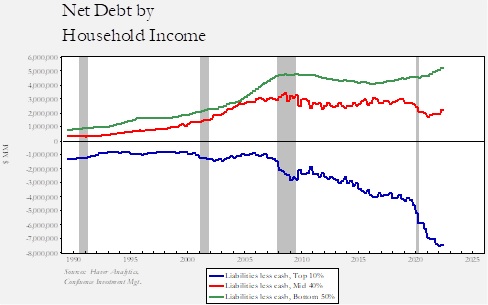
These top 10% of households have remarkably strong balance sheets. Their cash holdings less liabilities are sharply negative, meaning their cash position is very positive. If this cohort moves to buy equities, they clearly have the cash to do so. Of course, they could buy other assets as well, but the cash position of the top 10% does temper our bearishness as recession looms.
To visualize how this bear market would compare to history, we have constructed a chart that compares the Friday close for the S&P 500 Index to the market’s peak.
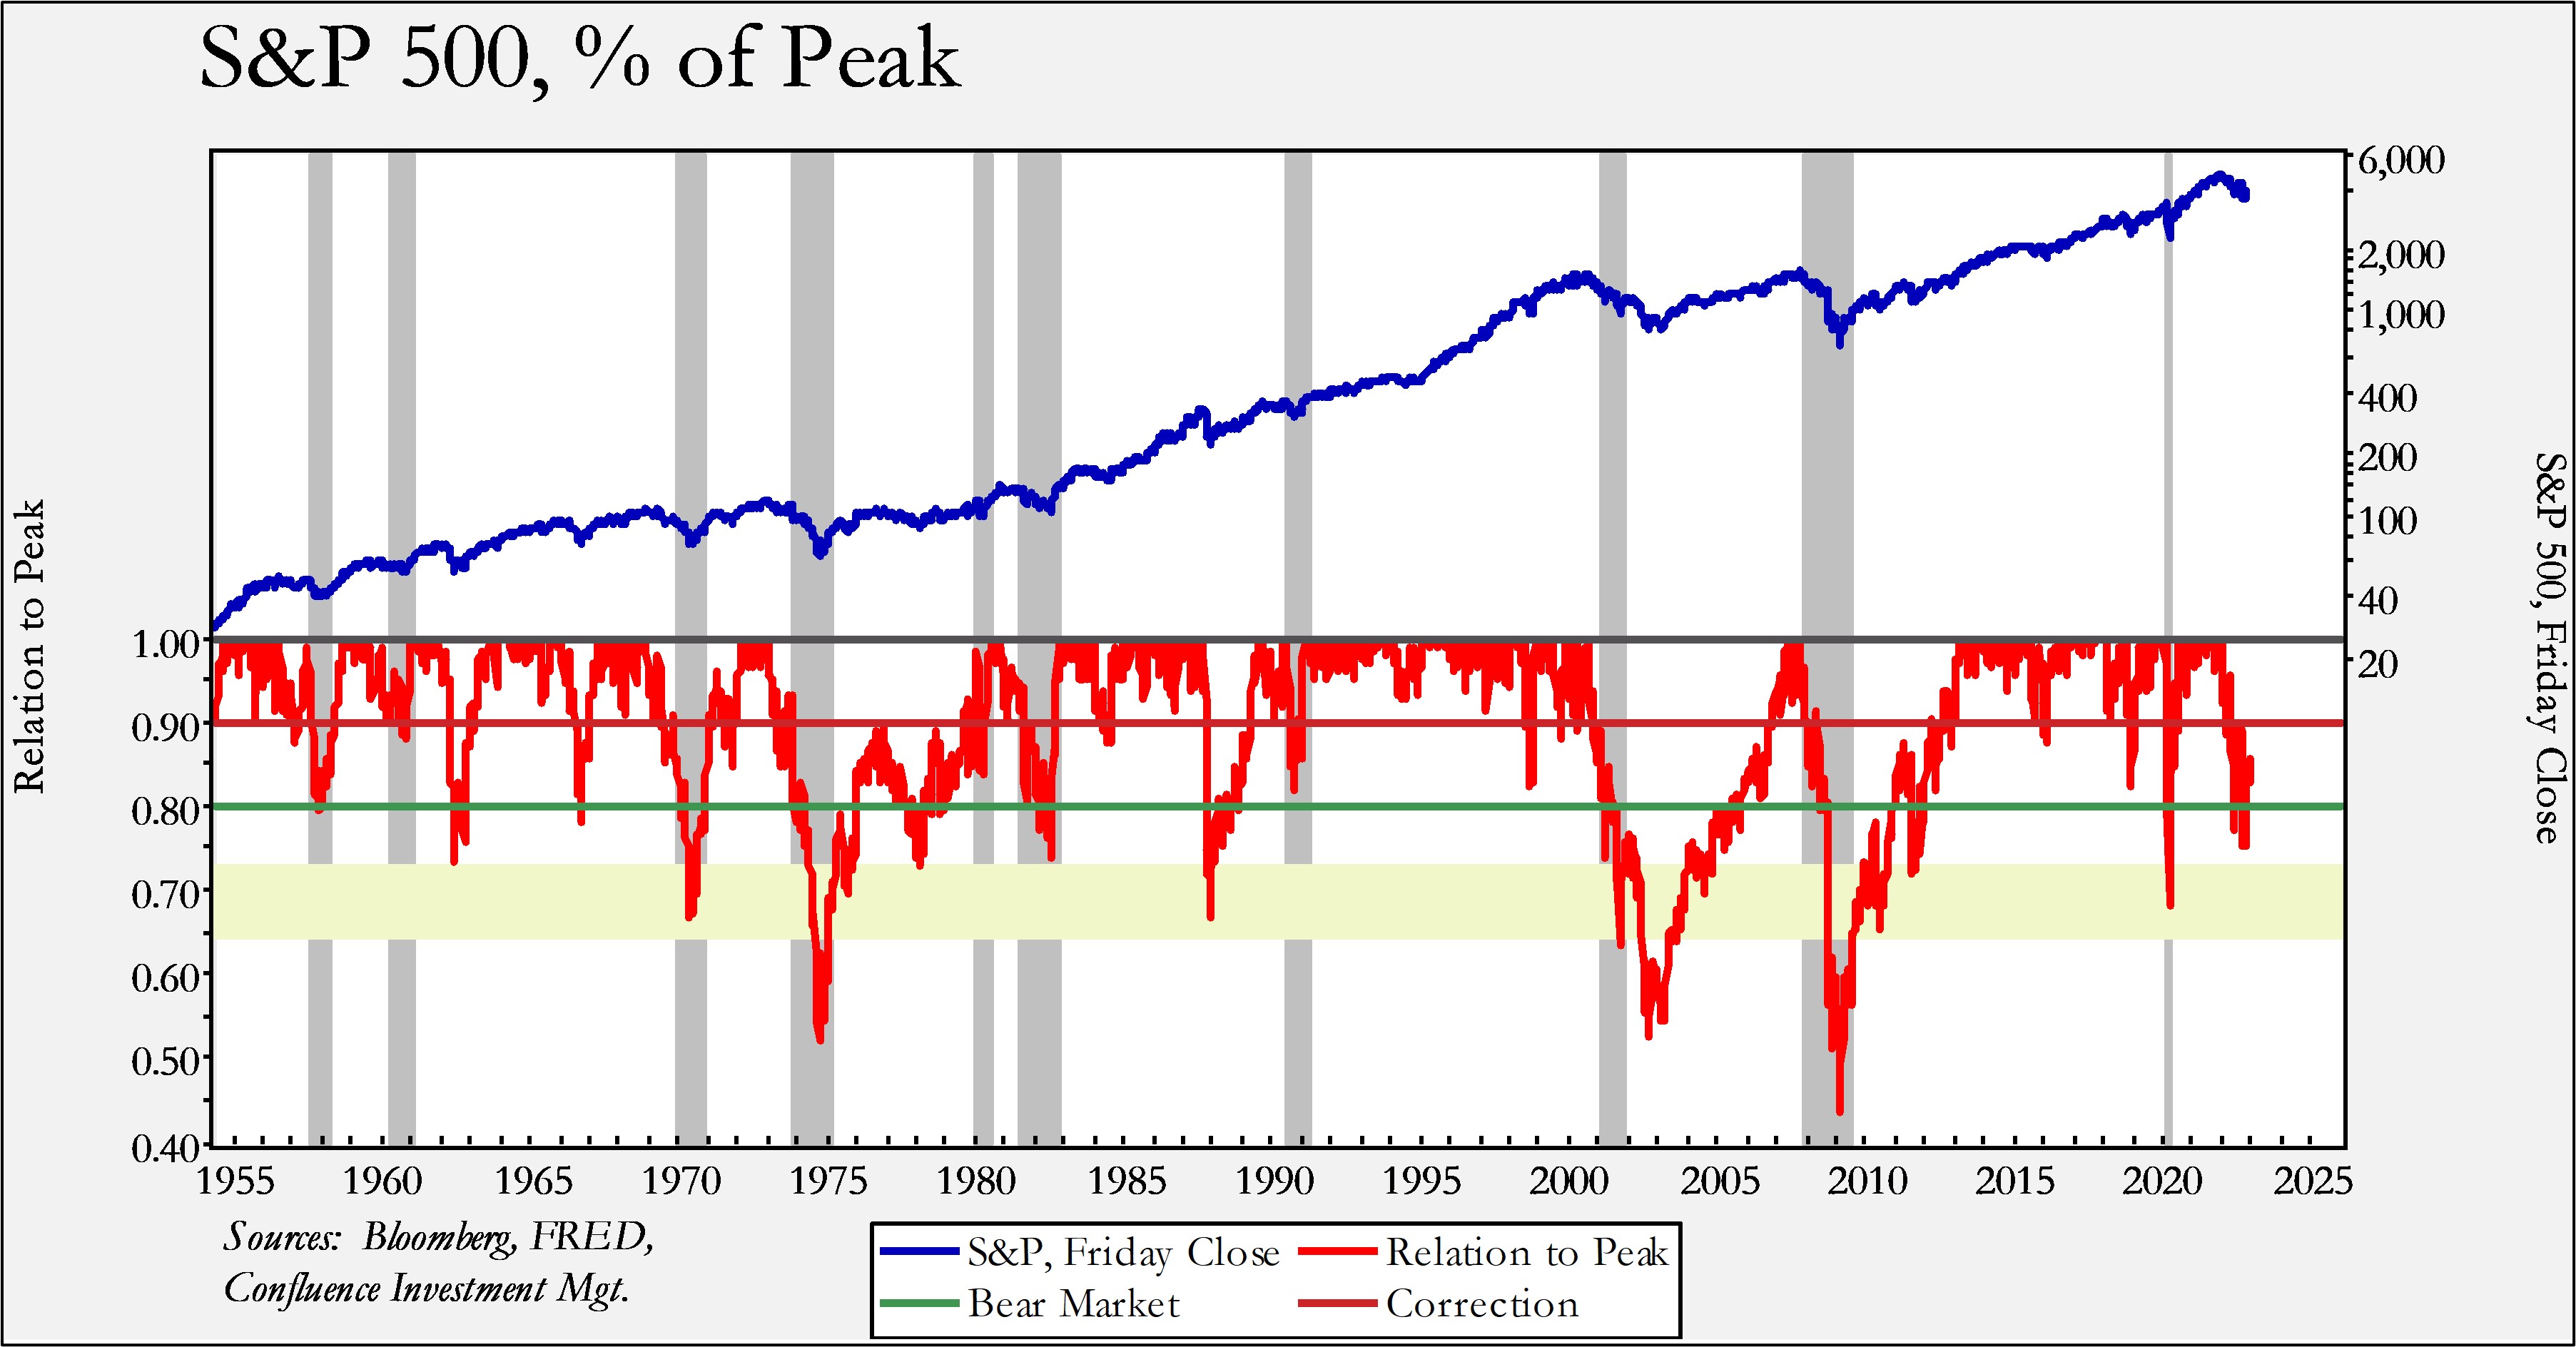
The thick lower band (in yellow) on the above chart depicts our recession projection for next year. As it shows, we are looking for more downside but not a decline as substantial as the major bear markets of the past 70 years. We also want to reiterate that this is the range where the bottom of the market will likely form. At some point, the recession will begin and end; the S&P 500 often bottoms about three-to-five months before the recession ends, whereupon a recovery starts. If the recession occurs in the first half of the year, then a recovery toward the 4100-4300 level would be expected. Given how well-anticipated this recession is, it would take an exogenous event to discourage investors from “looking through” this downturn.
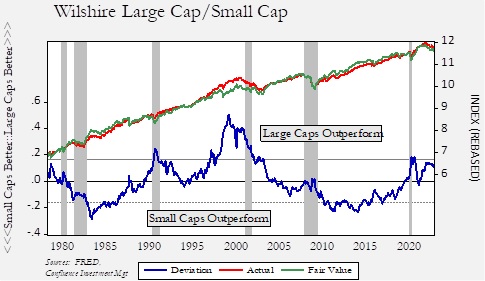
In terms of capitalization, we have tended to favor small caps given the outperformance of large caps in recent years.
In this model, we regress the Wilshire Large Cap Index against the Wilshire Small Cap Index. We have seen large caps outperform in recessions, as was the case during the 1990 and 2020 recessions. On the other hand, in the 1980 and 1981-82 recessions, small caps fared relatively better. Given the starting position of large caps heading into this downturn, we look for better performance from small caps.
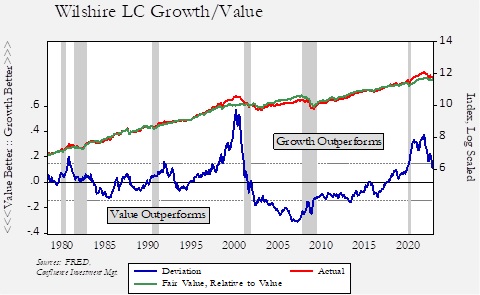
In terms of Growth/Value, the former has been gaining on the latter since the Great Financial Crisis, but that trend began reversing late last year. We expect that Value will continue to outperform.
The U.S. dollar (USD) is the key variable regarding foreign versus domestic equity weightings. To visualize this factor, we first establish dollar cycles.
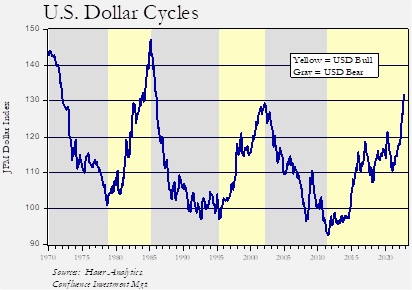
Dollar cycles tend to be rather lengthy, running at least seven years.
Although the relative performance of foreign and U.S. equities isn’t fully explained by the exchange rate, in the early stages of a currency cycle, foreign stocks tend to do better in dollar bear markets, while U.S. markets outperform in dollar bull markets. Of course, this is in relation to USD-based investors.
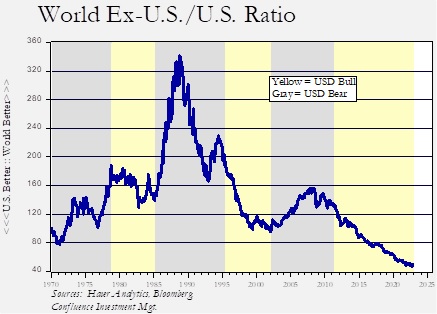
This chart examines the MSCI World-ex U.S. Index relative to the MSCI U.S. Index, in USD terms. Note that foreign markets tend to outperform in the early stages of the dollar bear markets, although that outperformance usually wanes over time. As noted, the U.S. tends to mostly outperform in dollar bull markets.
So, the key question is, “what will the dollar do in 2023?” There is no generally accepted method for dollar valuation. The most common methods are to compare relative interest rates, inflation rates, or productivity. If any of these methods were consistently better, multiple comparison models wouldn’t exist. We find that relative inflation rates, often called “purchasing power parity,” is useful in determining when exchange rates are at valuation extremes. Across the spectrum of currencies, the dollar appears to be overvalued.
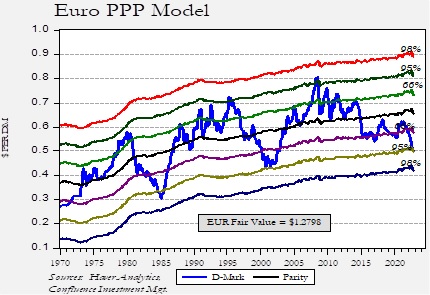
This parity model compares German to U.S. inflation, using the D-mark (DEM) for the currency; after 2000, the currency is the euro (EUR) translated into DEM. Since European inflation has been rising faster than U.S. inflation, fair value has declined from about $1.30 earlier this year to just under $1.28. However, even with that decline, the dollar is in the second standard error region, which in the past has been an area where the dollar is prone to reversals.
Why has the dollar been so strong? An important element has been tighter monetary policy in the U.S. relative to the Eurozone.
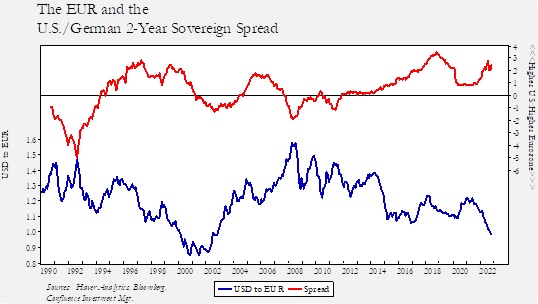
The dollar bull market that ended in 2002 was aided by the spread between U.S. and German two-year sovereign debt moving in favor of Europe. We expect the dollar will remain elevated until it becomes clear that the Fed is reversing its tightening policy.
For now, we lean toward overweighting the U.S. relative to foreign stocks; however, we expect the relative outperformance to transpire in the “late innings.” At some point next year, the dollar will likely reverse and foreign stocks will outperform. The recent pullback in the dollar could be the market starting to discount that outcome, although we don’t think this pullback will have legs in the short run. Nevertheless, we look for dollar weakness to develop sometime in 2023, which will tend to support international equities.
This reversal would be exacerbated if the Fed decides to support the financial markets instead of achieving its inflation goals. The risk of a premature easing would likely be felt strongly in the dollar and, consequently, in foreign stocks and other assets that do well in weak dollar environments.
Commodities
Investors often think of commodity investing as simply holding gold, but we see this as a form of category error. Gold is, in our view, a currency. Unlike fiat currencies, which are created either by governments or through the banking system via lending, gold is considered a non-liability backed currency. Therefore, we separate our views on commodities, in general, and gold, in particular. We will first look at commodities.
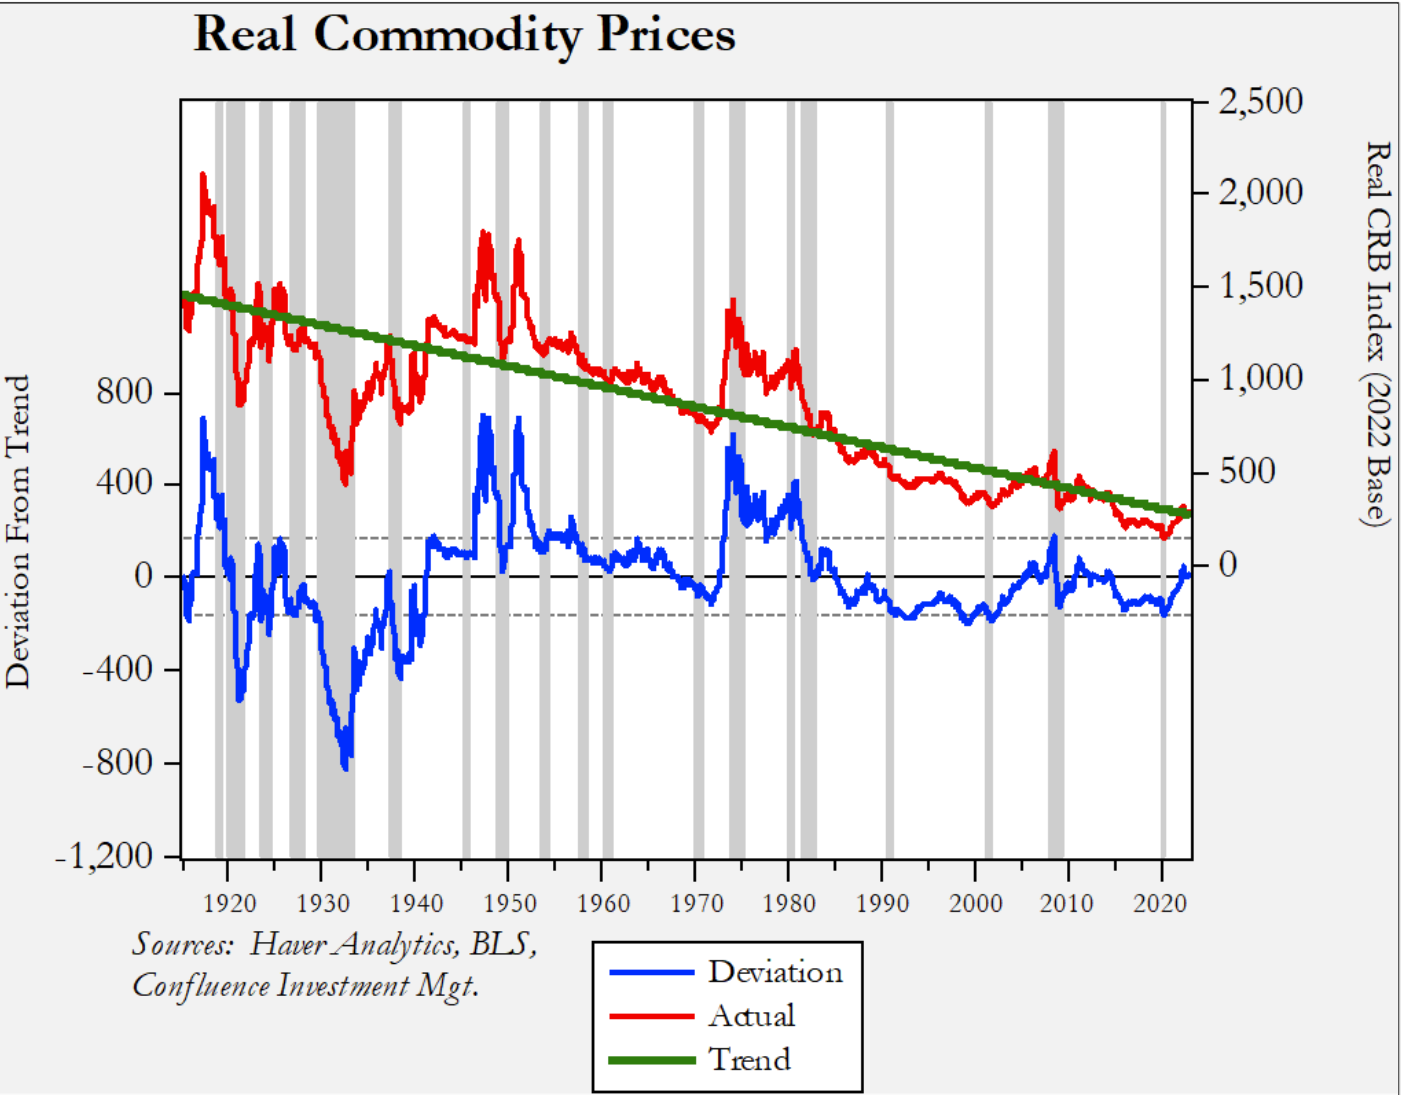
This chart shows the CRB index of commodity prices indexed to U.S. CPI. We have regressed a time trend through the data. The descending trendline shows that, most of the time, commodity prices fall relative to inflation. Thus, investing in commodities is not typically a profitable endeavor. However, the deviation line shows that there are occasions when commodity investing does work. These cases are usually related to wars or periods of monetary uncertainty. For example, there are obvious peaks that emerge for WWI, WWII, and the Korean conflict. The longest bull market was in the 1970s, which was partly fueled by the Vietnam War but mostly driven by monetary uncertainty caused by the end of the Bretton Woods Agreement. There was a minor commodity bull market from 2000 into 2008 that was triggered by the voracious demand from China. Since the end of 2020, commodities have been rising mostly due to the supply disruptions caused by the pandemic and excessive monetary and fiscal stimulus, which were policy responses to that event.
Our expectation is that the end of the post-Cold War globalization and waning U.S. hegemony will cause another bull market in commodities.4 However, as the above chart shows, even in commodity bull markets, prices tend to decline during recessions. We have generally maintained a position in commodities in our Asset Allocation portfolios but have reduced it recently. For the first half of 2023, we would expect generally soft commodity prices. However, if our expectations of eventual dollar weakness develop next year, a rebound in commodities is likely. This expected rally would be bolstered if the FOMC pivots prematurely, raising fears that the central bank is less committed to inflation control.
We use two different models to value gold. The first is a broad model that uses various monetary factors, the dollar, and the fiscal deficit, while the second variation of the model also includes bitcoin prices.
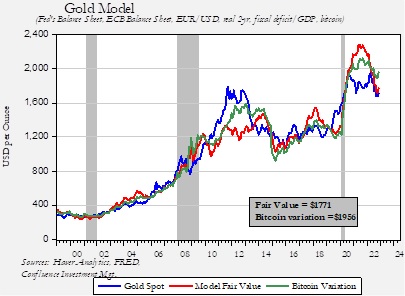
Gold is about fairly valued in relation to the basic model, but it doesn’t appear that gold has reflected the drop in value of bitcoin. Cryptocurrency is often considered an alternative to gold, and it tends to be affected by factors that impact gold as well. Overall, we tend to trust the basic model due to the relatively short track record of bitcoin. If anything, the gold model might be suggesting that bitcoin has further downside risk.
The second way we look at gold is relative to the dollar.
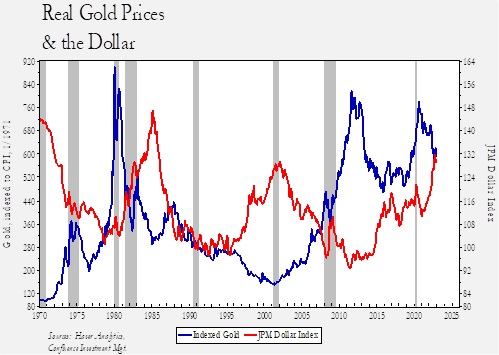
This chart deflates gold prices by U.S. CPI and indexes the price to January 1971. We compared this indexed real gold price to the JP Morgan Dollar Index, which adjusts the dollar’s exchange rate by trade patterns and inflation. The chart shows that periods of dollar strength tend to lead to weaker gold prices and vice versa. It also indicates that gold is less of an inflation hedge and more of a currency. If our expectations for a weaker dollar in the latter half of 2023 are correct, we would expect gold prices to benefit. And, similar to commodities, if monetary policy makes a premature pivot, gold should also benefit.
For next year, we expect oil to trade in a range of $65 to $95 per barrel. Gold is expected to rise toward $1,900 per ounce, with the lows near current levels.
Conclusion
As noted above, we expect a recession in 2023. The bigger picture is that we anticipate 2023 will be the year in which it becomes more evident that we are transitioning from the unified world of the post-Cold War order into a more fractured one. We think this world has been unwinding for some time, but the pace is beginning to accelerate. The breakdown of the post-Cold War order will tend to be inflationary. The impact on financial markets, broadly speaking, is the following:
- A secular bear market in bonds is likely beginning, which would suggest a steady rise in long-dated yields. This year, we expect that process to be modest due to the recession.
- In equities, multiple compression usually follows higher inflation. We assume this will be a 2024 issue, but a long period of sideways markets would not be a surprise. Although passive index investing will likely underperform, there will be opportunities in various parts of the equity market. For next year, the recession will presumably bring lower values, although a strong recovery in the market at year’s end is probable.
- Commodities tend to benefit from higher inflation. That may not be the case in early 2023, but like equities, a strong rally from a recession low would be expected.
Mark Keller, CFA
CEO & Chief Investment Officer
Bill O’Grady
Chief Market Strategist
Patrick Fearon-Hernandez, CFA
Market Strategist
December 21, 2022
This report was prepared by Mark Keller, Bill O’Grady, and Patrick Fearon-Hernandez of Confluence Investment Management LLC and reflects the current opinion of the authors. It is based upon sources and data believed to be accurate and reliable. Opinions and forward-looking statements expressed are subject to change. This information does not constitute a solicitation or an offer to buy or sell any security.
Confluence Investment Management LLC
Originally published by Confluence Investment Management.
For more news, information, and analysis, visit the ETF Strategist Channel.
