
By Natalia Gurushina
Chief Economist, Emerging Markets Fixed Income
EM and DM tightening cycles are getting less synchronized. Can EMs handle earlier exits and rate cuts?
Global Tightening Cycle
The market is still digesting the Japanese central bank’s (BoJ) unexpected decision to widen the yield curve control band, which re-set all major rates higher and propelled the Japanese yen 335bps up against the U.S. Dollar. One immediate question is whether today’s move and a prospect of further adjustment send a bearish signal for global equities. Even though the outgoing governor Kuroda argues that this is not policy tightening (the BoJ simultaneously pledged to increase bond purchases), the market might be forgiven for thinking that the BoJ will blink again. As regards emerging markets (EM), we have not seen major changes in the market expectations for EM policy rates this morning, and EM FX was doing quite well.
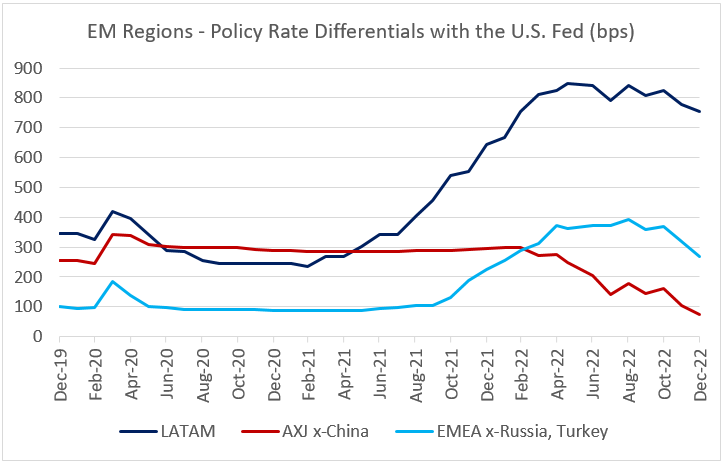
EM Policy Rate Differentials
However, Japan’s hawkish maneuver draws attention to the fact that the current tightening cycle in EM is not as synchronized with developed markets (DM) as before. Most EM central banks started to tighten much earlier than their DM counterparts, but major central banks gained pace in 2022. The U.S. Federal Reserve actually out-hiked most EMs in Q4, compressing the policy rate differentials with all EM regions (see chart below). This might be less of a problem in LATAM, where the policy differential is still the widest. However, it remains to be seen whether this would be enough to compensate for the political noise and policy uncertainty in the region. For example, Brazil’s swap curve continues to price in a small “warning shot” rate hike in early 2023 to address new administration’s spending plans.
EM Rates and China Reopening
The policy rate differential between EM Europe and the Fed is still above the pre-pandemic levels. Central Europe is not in the mood to hike further (Hungary stayed on hold today, and the Czech Republic will most likely follow suit tomorrow), but uncertain disinflation paths, and persistent concerns about the post-election fiscal adjustment in Hungary and pre-election fiscal splurge in Poland introduce additional risks. EM Asia’s policy rate differential with the Fed is the smallest – less than 100bps – and this “cushion” might be too thin, unless we see more capital inflows aiming to benefit from the China reopening theme. Stay tuned!
Chart at a Glance: EM Policy Rates “Cushion” – Large Enough?
Source: VanEck Research; Bloomberg LP.
Originally published by VanEck on 20 December 2022.
For more news, information, and analysis, visit the Beyond Basic Beta Channel.
PMI – Purchasing Managers’ Index: economic indicators derived from monthly surveys of private sector companies. A reading above 50 indicates expansion, and a reading below 50 indicates contraction; ISM – Institute for Supply Management PMI: ISM releases an index based on more than 400 purchasing and supply managers surveys; both in the manufacturing and non-manufacturing industries; CPI – Consumer Price Index: an index of the variation in prices paid by typical consumers for retail goods and other items; PPI – Producer Price Index: a family of indexes that measures the average change in selling prices received by domestic producers of goods and services over time; PCE inflation – Personal Consumption Expenditures Price Index: one measure of U.S. inflation, tracking the change in prices of goods and services purchased by consumers throughout the economy; MSCI – Morgan Stanley Capital International: an American provider of equity, fixed income, hedge fund stock market indexes, and equity portfolio analysis tools; VIX – CBOE Volatility Index: an index created by the Chicago Board Options Exchange (CBOE), which shows the market’s expectation of 30-day volatility. It is constructed using the implied volatilities on S&P 500 index options.; GBI-EM – JP Morgan’s Government Bond Index – Emerging Markets: comprehensive emerging market debt benchmarks that track local currency bonds issued by Emerging market governments; EMBI – JP Morgan’s Emerging Market Bond Index: JP Morgan’s index of dollar-denominated sovereign bonds issued by a selection of emerging market countries; EMBIG – JP Morgan’s Emerging Market Bond Index Global: tracks total returns for traded external debt instruments in emerging markets.
The information presented does not involve the rendering of personalized investment, financial, legal, or tax advice. This is not an offer to buy or sell, or a solicitation of any offer to buy or sell any of the securities mentioned herein. Certain statements contained herein may constitute projections, forecasts and other forward looking statements, which do not reflect actual results. Certain information may be provided by third-party sources and, although believed to be reliable, it has not been independently verified and its accuracy or completeness cannot be guaranteed. Any opinions, projections, forecasts, and forward-looking statements presented herein are valid as the date of this communication and are subject to change. The information herein represents the opinion of the author(s), but not necessarily those of VanEck.
Investing in international markets carries risks such as currency fluctuation, regulatory risks, economic and political instability. Emerging markets involve heightened risks related to the same factors as well as increased volatility, lower trading volume, and less liquidity. Emerging markets can have greater custodial and operational risks, and less developed legal and accounting systems than developed markets.
All investing is subject to risk, including the possible loss of the money you invest. As with any investment strategy, there is no guarantee that investment objectives will be met and investors may lose money. Diversification does not ensure a profit or protect against a loss in a declining market. Past performance is no guarantee of future performance.
