
By Komson Silapachai, Vice President, Research & Portfolio Strategy
This week the Consumer Price Index (CPI) reading for November surprised to the downside for the second consecutive month, leading to the notion that inflation has peaked and shifting investors’ concerns to the potential for an economic slowdown. In light of this data, the FOMC carried on with the expected 50 basis point hike in the federal funds rate while signaling further hikes “until the job is done.” In this edition, we review recent developments in inflation, growth, and policy, as well as what investors can expect to start 2023.
Slowing Inflation
November CPI rose 0.1% (a rate of 7.1% YoY) while core CPI rose 0.2% (6.0% YOY), well below the median of Wall Street forecasts for the second month in a row. The pace of inflation seems to be slowing, which gives hope that supply chain issues and a hot economic environment are ending. This also lays the groundwork for a shift in the Fed’s inflation fight through its tightening of financial conditions.
Consumer Price Index Shows Slowing Inflation
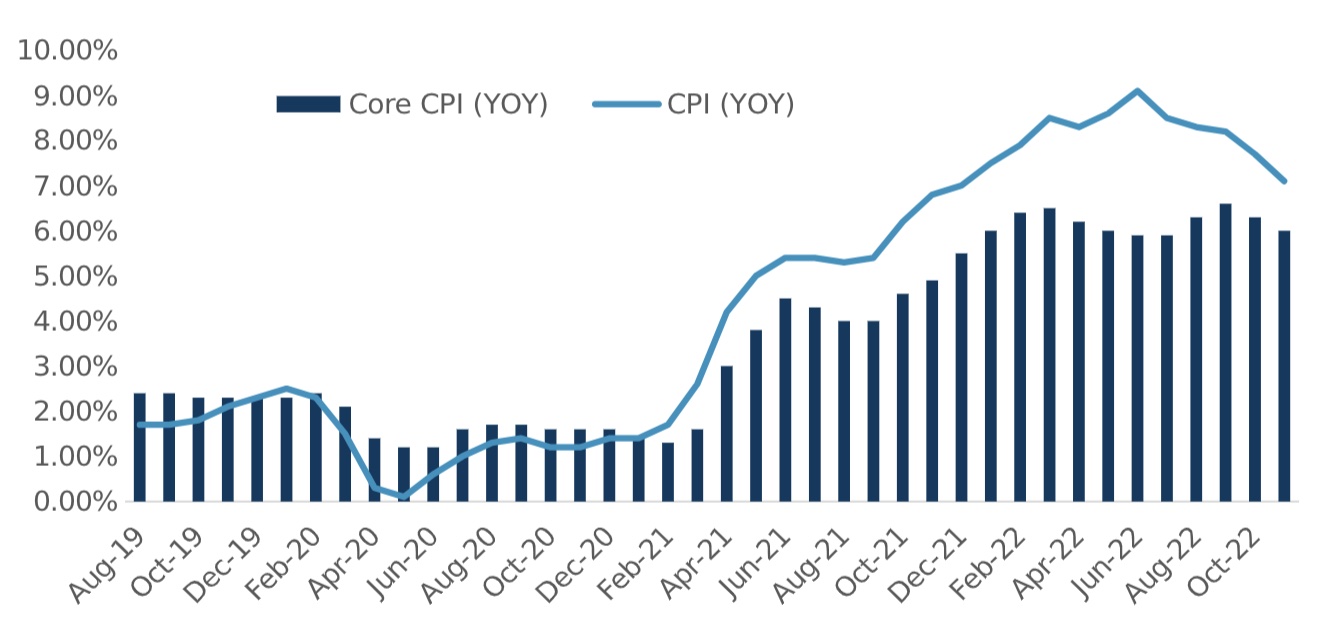
Source: Sage, Bloomberg
From Inflation to Recession Fears
The fear of runaway inflation that has dominated the market narrative in 2022 is now changing to concerns around a growth slowdown. Although the labor market remains tight, cracks are appearing that could signal an end to the current economic expansion in the next 12 months. The chart on the following page shows the Purchasing Managers’ Index (PMI) across manufacturing services for both small and large companies. The PMI surveys are a leading indicator of economic growth because they provide a timely and forward-looking view of conditions in the manufacturing and services sectors.
The PMI surveys ask purchasing managers to rate the relative level of business conditions, including employment, production, new orders, prices, and inventories. A reading above 50 indicates that the manufacturing or services sector is expanding, while a reading below 50 indicates that it is contracting. Three out of four indicators are currently well in contraction territory, which could foreshadow a period of slowing growth or recession.
Purchasing Managers’ Index Points to an Economic Slowdown
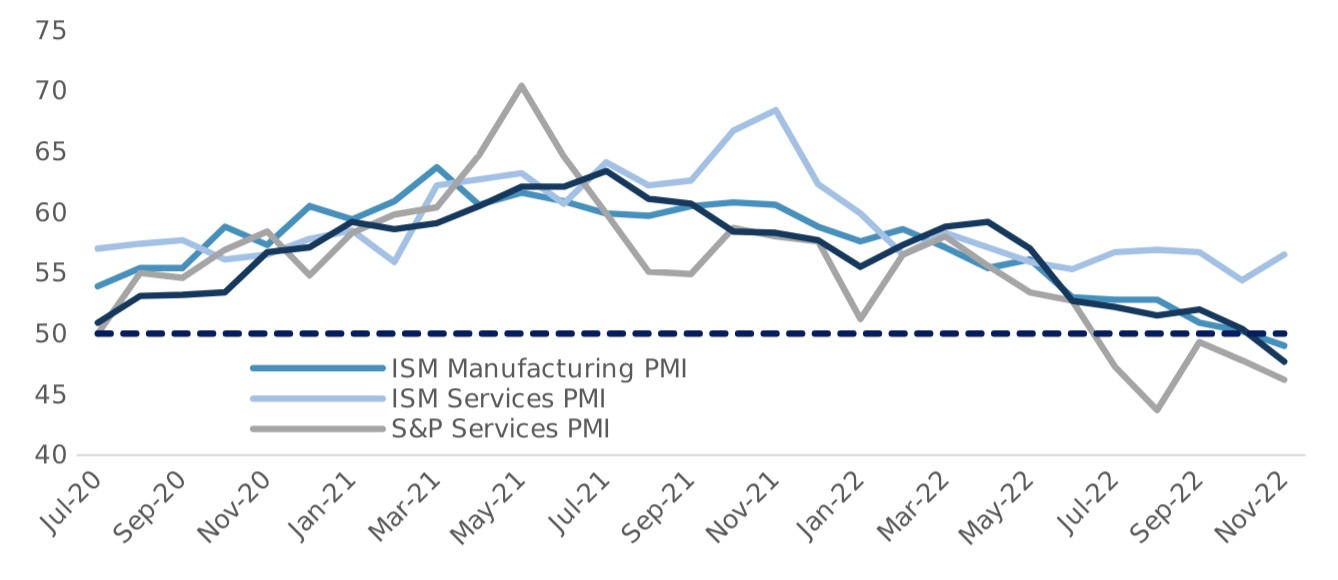
Source: Sage, Bloomberg
The FOMC Nears the End of the Hiking Cycle
What is currently priced into the path of the federal funds rate? According to the SOFR futures curve, the Fed is expected to hike into the 4.75% to 5% range by March 2023, then pause and resume cutting rates by the second half of 2023. This would involve a deep recession scenario and is not consistent with the valuations in either equities and/or rates.
Secured Overnight Financing Rate (SOFR) Futures Curve
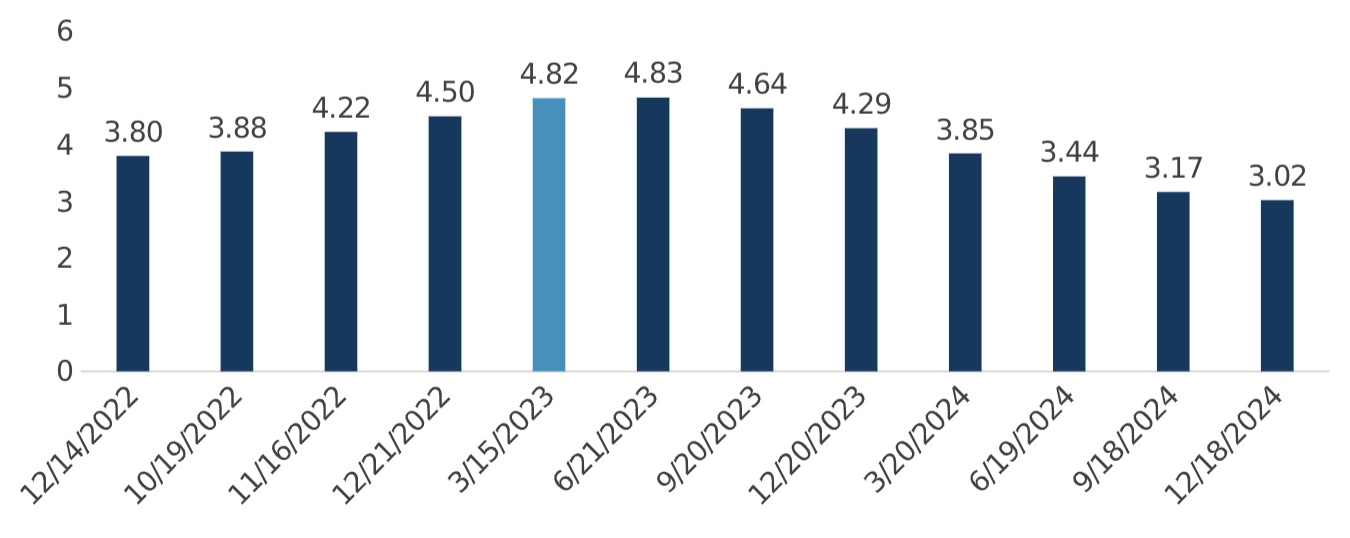
Source: Sage, Bloomberg
The Risk/Reward is Better for Rates, While Equities and Credit are Fully Valued
What gives? Investment grade corporate spreads remain at 130 basis points and high yield is at 450 basis points above Treasuries. Additionally, the S&P 500 is trading at 18x earnings on a forward basis, which includes 9% earnings growth in 2023. The equity and credit markets are clearly pricing in a “soft landing” scenario.
The rates markets are telling a different story. The yield curve is deeply inverted, and the markets are pricing in Fed rate cuts starting in the second half of 2023. Given our base case of a modest recession in 2023, the risk/reward in core fixed income is superior to equities and other risk assets. We remain cautious on spreads, particularly in corporate bonds, where spread widening episodes often accompany recessions. Nonetheless, we’re likely to see an economy that looks like the opposite of 2022: slowing growth and slowing inflation.
For more news, information, and analysis, visit the ETF Strategist Channel.
Disclosures: This is for informational purposes only and is not intended as investment advice or an offer or solicitation with respect to the purchase or sale of any security, strategy or investment product. Although the statements of fact, information, charts, analysis and data in this report have been obtained from, and are based upon, sources Sage believes to be reliable, we do not guarantee their accuracy, and the underlying information, data, figures and publicly available information has not been verified or audited for accuracy or completeness by Sage. Additionally, we do not represent that the information, data, analysis and charts are accurate or complete, and as such should not be relied upon as such. All results included in this report constitute Sage’s opinions as of the date of this report and are subject to change without notice due to various factors, such as market conditions. Investors should make their own decisions on investment strategies based on their specific investment objectives and financial circumstances. All investments contain risk and may lose value. Past performance is not a guarantee of future results.
